Convert 2D table to single column (Renew and amend the query)

@JohnSUN You posted a solution to this item in 2020 which has been closed. your solution included

  • Ctrl+Shift+V (menu Edit-Paste
    Special), T (choose Transpose),
    Enter (paste and close menu)
  • Ctrl+X (cut transposed table)
    How significant is the pasted transposition as I have a matrix with 3000+ rows which obviously transposes beyond the max column count of a sheet?
    I assume I could probably do the job as you suggest with perhaps four portions of the array to avoid the column count clash but I’m currently running the simple paste special into a text document - without the prior transposition - which has been chugging away since before I started this post.
    I suspect it doesn’t like it so when I finish my tea, I’ll probably have to kill the unresponsive LO.
    Thanks in anticipation

Take your time, after tea, drink more coffee. While you’re at it, explain in more detail what you want to do with this gigantic data set.

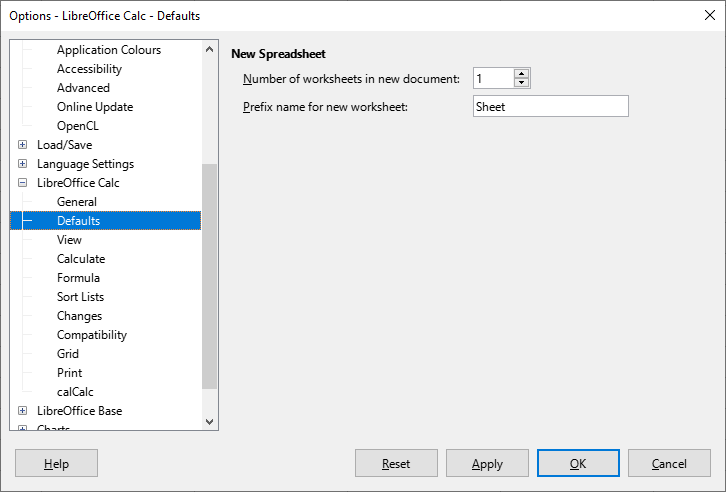
By default, the spreadsheet contains AMJ columns (1024 in total) - not enough to fit 3000 rows after transposition. However, take a look at Tools - Options - LibreOffice Calc - Defaults. There is now an option Enable very large spreadsheets. Just try. The number of columns will increase to 16384, this should be enough. (Don’t forget to restart office after setting this option)

I wanted to analyse character frequency in that new word game craze “wordle” and decided to see if the original frquency count based upon Morse Code (ease of use) frquency was valid for a sample with exclusively 5 character words. It’s NOT - Big variations.
I originally cut and pasted from a web based “scrabble” cheat 12k+ words which were arrayed as words ending with “a”, “b”, “c”, etc., and kept the 26 a-z columns but they’re obviously sorted within their own final character sets.
It was easy enough to just “move” each column to the end position of the combined column but I was curious as to whether or not there was a working function or procedure in LO.
You were one of the usual suspects :wink::+1: so I thought I’d delve deeper.
Going to try the “extended range” now

For the record, this is the frequency of each character in the 5 letter word sample together with the sample percentage (3rd row) and the original comparable Morse Code distribution as the bottom row.

e s a o r i l t n u d y c p m h g b k f w v z j x q
6650 6639 5975 4411 4148 3737 3365 3283 2941 2504 2446 2052 2020 2008 1970 1749 1625 1618 1489 1108 1037 694 433 289 288 111
10,30 10,28 9,25 6,83 6,42 5,79 5,21 5,08 4,55 3,88 3,79 3,18 3,13 3,11 3,05 2,71 2,52 2,51 2,31 1,72 1,61 1,07 0,67 0,45 0,45 0,17
e t a i n o s h r d l u c m f w y g p b v k q j x z

Did you know? Mr Morse just went into a printer and counted the monotype pellets for each character in the work tray. Printers would know which characters they most regularly set into the frame “A Shooter” so he was able to make the regularly used characters the shortest Code sequences … — … had nothing to do with “Save Our Souls” it was just the shortest sequence to attract attention.

This is what I get in 7.2.5.2 - when is it due for general release?

Oh, first Enable experimental features in Tools - Options - LibreOffice - Advanced.

It crashed. I intended to complete the crash report but the recovery process disappeared the memo pane so I have no references. It Happens :man_shrugging:

It’s a pity that Calc couldn’t cope with this task. On the other hand, there is good news - this work has been done for you many times and achieved some success. (See also here)

And I was having so much fun trying to figure it out.
I think there may still be a noticeable difference as I’m focused on only 5 letter words but your source will certainly give me a better data set for comparison.
Look forward to examining it.
Thanks - I definitely learned more than two things today
I also submitted and qualified two crash reports😫

Very easy to do with some database, for instance HSQL2.
From a table with 106 person names and another table with 26 letters of the alphabet, the following “formula” returns a table of 106x26 rows with the count of each characters for each surname.

SELECT LOWER ( "Persons"."SN" ) AS "Surname","CHARS"."C",  Cardinality(REGEXP_SUBSTRING_ARRAY(Lower("Persons"."SN"),"CHARS"."C")) AS "Count"  FROM "CHARS", "Persons"

It’s a different approach to what I was contemplating as I didn’t really concern myself with retaining the original 12k+ words, I only wanted to count the instances of the characters.
That said, I ended up modifying the sheet to contain a second array of 5 columns where each character in the source was assigned its position in column 1 - 5. Then a simple filter allowed me to target values in different locations. It’s an imperfect “cheat” but an unscrupulous player could select groups of words for inspiration. I tested it on existing successful plays and know it still can’t produce a final target within the 6 attempt limit but in some instances it could certainly provide perhaps 10 potential targets for the final move. I easily beat that so no real point in cheating. It was an amusement after I finished the frequency analysis - armed with the knowledge that the normal character distribution changes for 5 letter words.

Suggestion only addressing the reorganization of data from rectangular areas in spreadsheets to different ranges.
2D_to_1D is a special case.
See example: array2Dto1Ddemo.ods (11.3 KB)

With the help of the sufficiently efficient user function contained in the attachment, You can create the single column right of the source range if there is at least one unused column.
One column can accept the results if your original array of (about) 3000 rows has less than (about) 300 columns (about 900000 elements then)…

If your dataset is larger, the only relief is to abandon any spreadsheet solution. The feature of superlarge spreadsheets (not yet working for me) is a blind alley, imo. Development in that direction should be abandoned. (Sheets aren’t databases, and without basically droping the current principles of their working, they can’t comply with any attempt to make them arbitrarily scalable in size.)

Write your data to a csv, read and evaluate it line by line using specialized code. If time isn’t a lmiting factor, you can even do tzhis with LibO Basic - and probably wrtitze the results then to a spreadsheet…

1 Like

Wasn’t quite clear on where/what is PASDEDEUX()
I think I just got the JITTERBUG() with #VALUE!

I noticed a brief MACRO warning when I opened the file but having just reset my user profile from the large spreadsheet catastrophe I suspect there’s a parameter I haven’t yet re-discovered.
EDIT:
Definitely my bad - activated macros and that’s absolutely spot on :+1:
EDIT2:
=SUM((LEN(A6:A12998)-LEN(SUBSTITUTE(A6:A12998;B1;""))))
This does the counting with the assignment of B1 identifying the a-z
and applying it to your column as opposed to mine.
It’s definitely one of those learn 20 new things days today.

I’m now going to experiment further on my own data array as my source columns vary in length so the matrix will have only about 20% of populated cells. However, if it produces empty cells they will disappear with a paste special or filter ignoring blanks. If it pauses at empty cells then it’s more of a problem

An amazing template: [Tutorial] Rearrange rectangular data values (View topic) • Apache OpenOffice Community Forum

1 Like

Agreed, now I have another toy to play with. Thanks