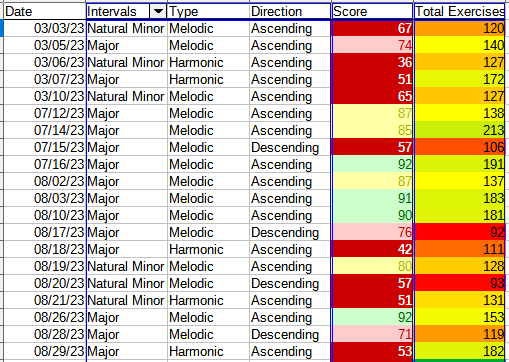
Hi. I’m trying to build a bar graph based on 3 “x” columns and 2 “y” columns.
The raw data looks like this:

and I want the graph to display the average of Score and the average of Total Exercises for each combination of Intervals, Type, and Direction. So, for the dataset as-is, there should be 6 sets of two columns: one for Major Melodic Ascending, one for Major Melodic Descending, etc. with the average of the Scores for MMA in one bar and the average for Total Exercises in the other. The best graph I can achieve just displays each each row in the dataset as its own entry in the bar graph.
I would also like this graph to update every time I add a new row to the dataset. As-is I have to update the data range every time I add a new row.
You should provide sample data, not a pretty picture
Something like a Pivot table graph?
BarGraphForAverages.ods (22.5 KB)
This works. Is it possible to make a pivot table that updates as I add new rows to the data?
Here is the data proper, I didn’t know I could attach it
EarTraining.ods (20.3 KB)
In my example I made the data plus an extra row a Named Range.
- Select the cells immediately below the last ones with data in.
- Right click and select +Insert > Move cells down
- Add data to new block of cells, make the Total Exercise cell something big, 500, so you will see the effect
- Right click pivot table and click Refresh. The pivot table and the chart will update
