Cropping a stacked area chart

Edited by @Hrbrgr from comment:

Further information:
It is a .ods file
in LibreOffice 7.3.7.2,
running in Ubuntu 22.04.1 LTS.

I have a stacked area chart showing 5 values over a period of more than 3 years.

In order to better show the latest development of those values, I changed the x and y axis so as to cut off the earlier days and the higher values.

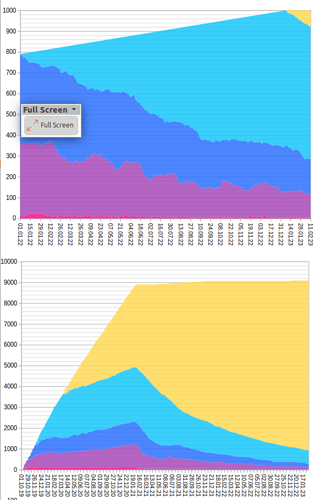
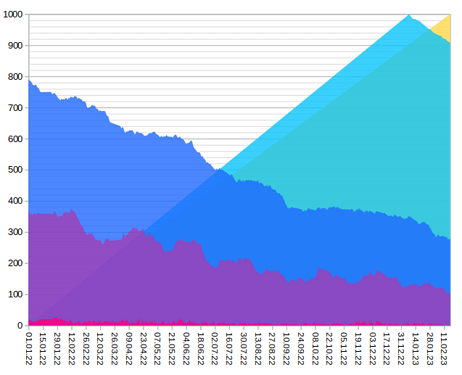
In the resulting chart I expected to see a cropped image of the lower right of the complete chart, but instead I get an empty triangle on the upper left (which should be colored light blue), no matter how I choose the cutoffs for both axis.

Here is a screenshot of the cropped chart and of the complete chart:


If you have not yet received a response, ask yourself the question, how do I make my description interesting enough for other users to want to respond?


Please complete your question.
The help on this page is mainly provided by users like you.

Your question and the corresponding description should be as detailed as possible.
Please remember that no one can look over your shoulder when you ask your question and describe it.

In order to be able to help you, we need to know your operating system and the LibreOffice version (four-digit, e.g. 7.3.2.2).
Please also state the file type in which you have saved your file.

All important information about your initial question should be present in the initial question box, otherwise edit and complete it., to do it.

Please do not use answers (solutions) or comments for this.

If you have already fulfilled some of these requirements, so much the better. Thanks.


Upload a reduced and anonymized file here so that someone can examine it.

Here you can find the further References for this page.


Thank you very much for your assistance.

Further information:
It is a .ods file in LibreOffice 7.3.7.2, running in Ubuntu 22.04.1 LTS.

BTW the same happens with non-stacked (normal) area charts. It gets even worse.
I thought I could make a work-around by replacing the data colums by their sums:
new column 1 = old column 1
new column 2 = old column 1 + old column 2

new column 5 = old column 1 + old column 2 + … + old column 5
The non-cropped chart looks exactly liked the stacked area chart before.
But when I now crop the result is:

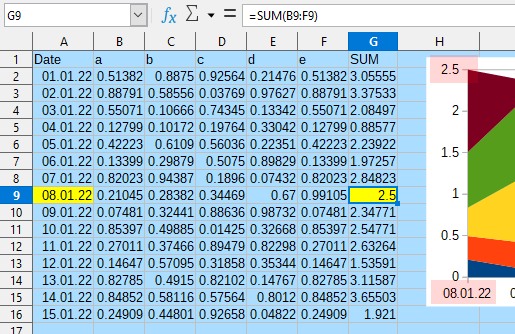
As a workaround, the Y Axis Maximum value must be equal or more than the sum of the 5 values at the first date (01.01.22 in your screenshot). So adjust the value in the fourth data column to not pass 1000.

imagen

I think that here is a bug.

Thank you for your answer.
In my case, if I adapt the y-axis it would go up to over 9000, and it wouldn’t be the cropped chart that I want. On the other hand I don’t want to manipulate the data just to get a correct chart.