Data labels in a chart are sourced from the first series instead of their own series

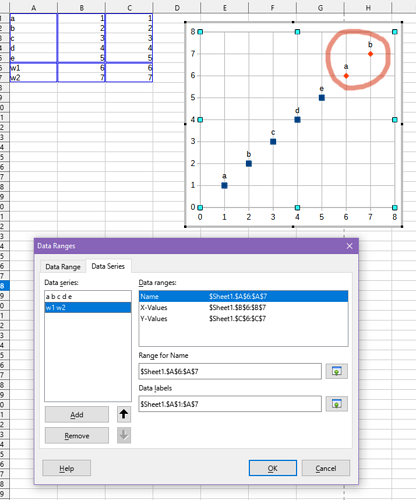
I’m almost certain this is a bug, but I have to confirm it first prior to filing it. This scatter diagram is using two series of data:

Untitled 1.ods (15.0 KB)

The problem is that labels for the second series (w1 w2) are sourced from the first series. The encircled names should have been w1 and w2.

That’s a bug, right ?

You don’t have to. When you feel it’s a bug, it’s best to just file it. If it turns out to be not a bug, it will be closed with an explanation; that is beneficial, because:

  1. Only once, people will need to evaluate it (not both here and there);
  2. You won’t waste energy, doing twice as much work;
  3. If that gets closed as not a bug, we will be able to use it as an anchor for similar cases (and at some point, may re-evaluate, because of much demand).

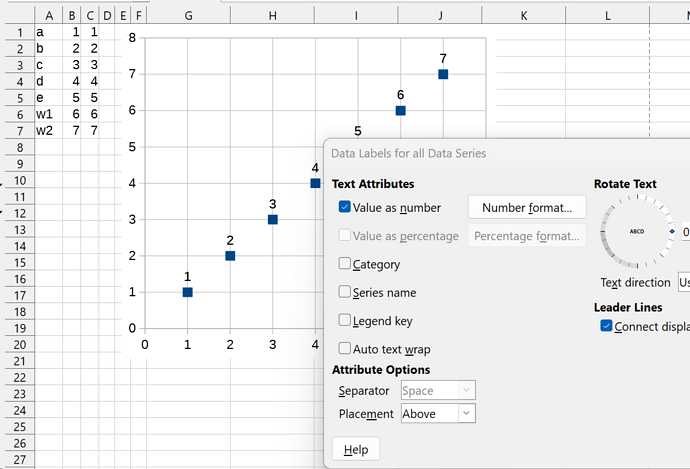
The main is you have set up for Data labels, ‘Category’ instead ‘Value as number’:

And you have set in Data Ranges, ‘First row as label’ which I think it is not.

It’s really an old bug, hopefully it will be fixed.

It’s tdf#38760 reported 2011-06-28 20:12 UTC and commented on 34 times since.
It doesn’t seem anybody is considering to assign herself to the bug as the one trying to resolve it.
I also couldn’t find a comment explaining for what reasons the bug can’t be fixed (compatibility problem [MS dictatorship]?? too difficult?? problems with odf file formats??). The bug simply is orphaned for nearly 13 years now.
I would like to learn for what resons new chart toys were added, but a substantial (imo) bug not was addressed.
My own comment (#30), about 1.5 years old now, wasn’t re-commented substantially.

Somebody urgently needing a workaround can possibly start with my very raw example to find in the attachment to my above mentioned comment #30. It surely needs enhancements. (I don’t need such features any longer myself. The demo was made from the point of view of a retired math teacher who hates the spreading of illogical habits/states/softwares.)