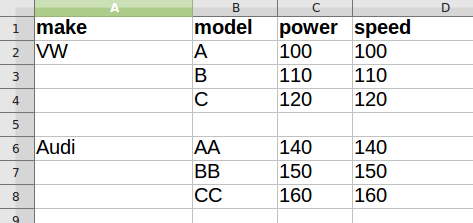
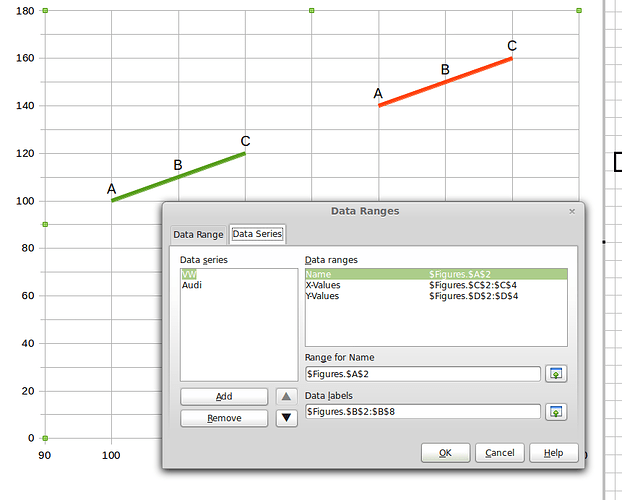
I have a simple XY Scatter (lines only) graph, all the data comes from a separate sheet. There are two data series - see the two attached pictures.
I have selected Data Labels - Show Category. It doesn’t seem to use column B properly to supply the labels. If I choose B2:B4 for VW (to get A, B, C) then try to change the Audi range to B6:B8 (to get AA, BB, CC), I find that the VW range has changed to that as well. It seems to use the same set to apply to both series. In the example here I have set it to B2:B8 hoping it will sort it out itself but as you can see it just starts at the beginning with A for each series. Perhaps I don’t understand data ranges properly.


