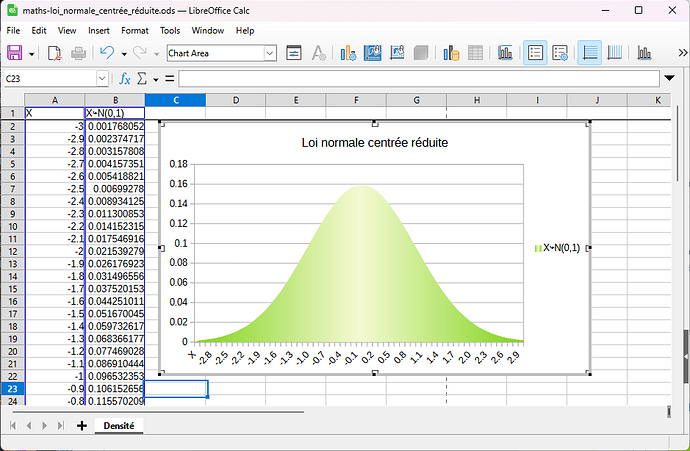
Evenly labeled X axis and added vertical line

In
maths-loi_normale_centrée_réduite.ods (39.2 KB)
, which preview is


I’d like the X axis to be evenly labeled, as well as those labels having the same number of decimals, and a label for X = 0. In lower priority, I’d like a vertical line at X = 0.

Thank you kindly

PS: Even lower priority would be for the area under the curve to have a very pale color between for X [−1.96, 1.96], pale outside but between [−2.58, 2.58], and plain color outside of that ; eg: green, light green, very light green, light green, green.

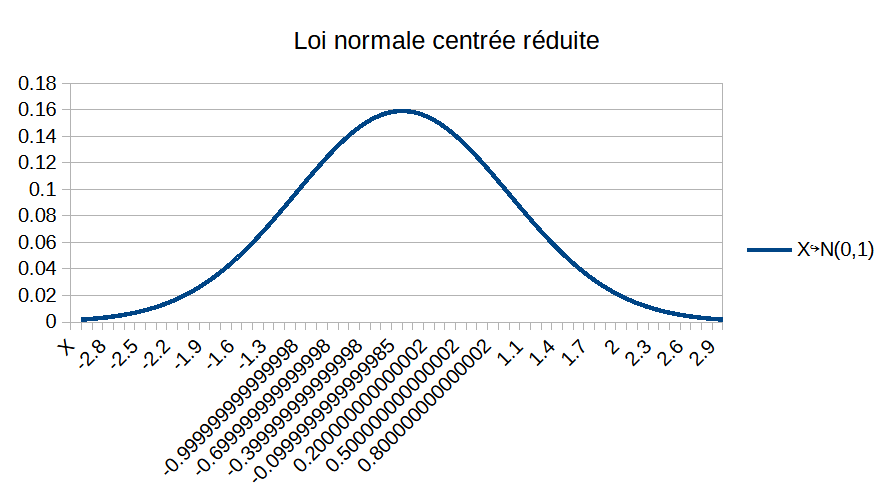
Formula in A3: =ROUND($A2+0.1;1)

@DynV
Try a XY diagram instead of a line diagram.


1 Like

Maybe you can address the OP PS? If area is too complicated, perhaps vertical lines?

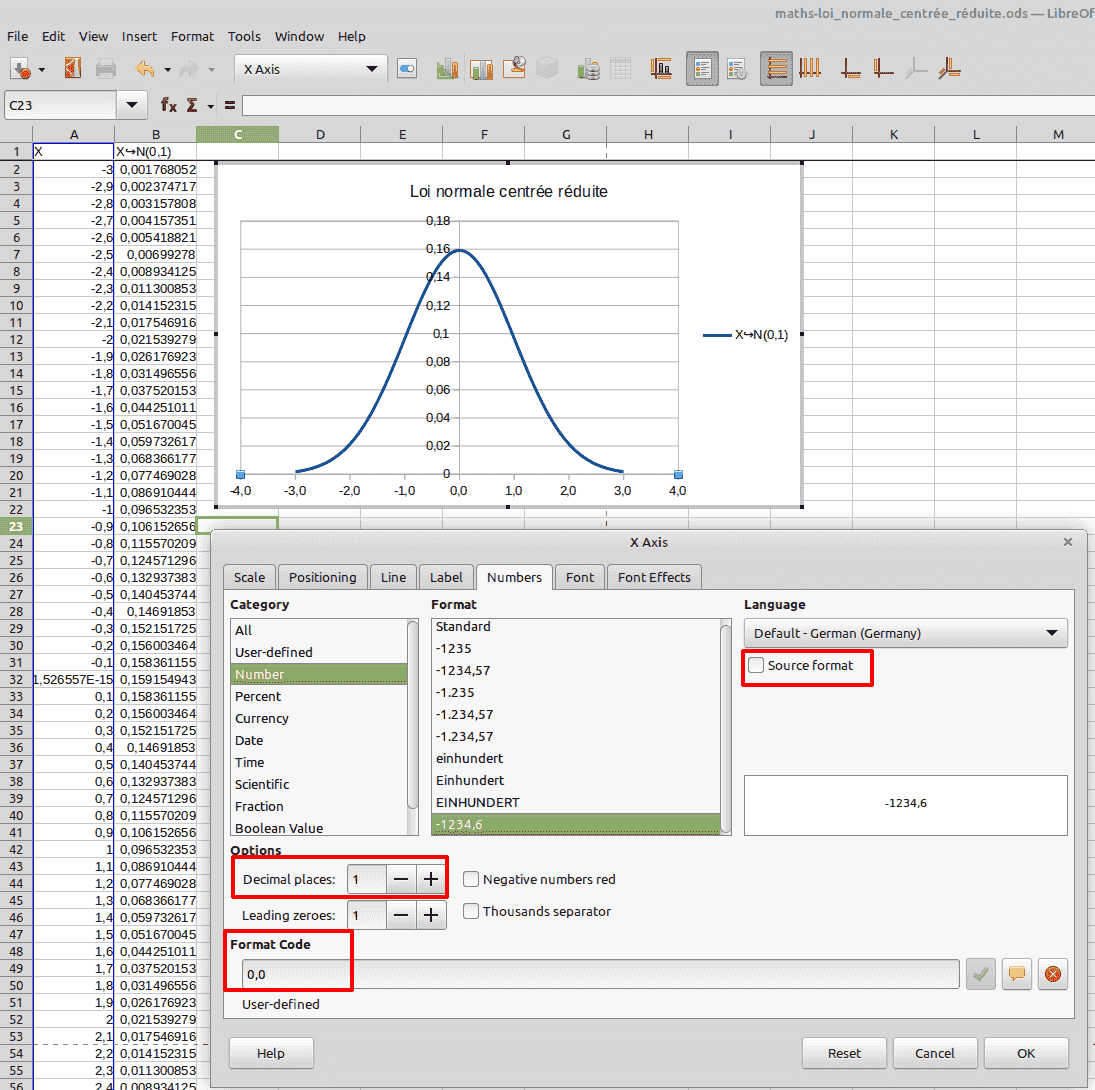
Double-clicking the axis (or choosing FormatAxisX Axis menu), you can setup the axis properties, including number format:

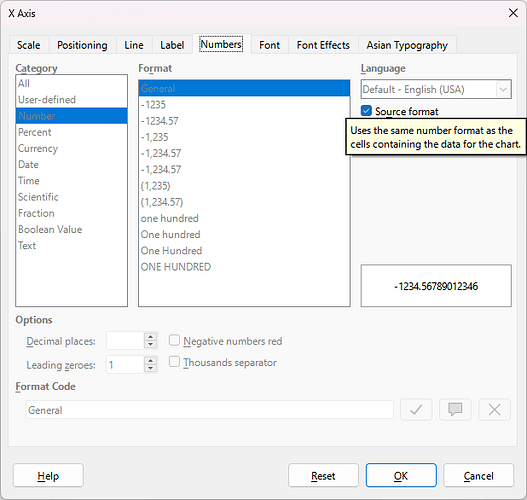
The “Source format” checkbox should be cleared to allow you to type something like 0.0 into the Format Code box.

And the advise of @Grantler is the correct one, when your X axis is actually numbers, not labels: use XY diagram then. That allows to set up its range and more.

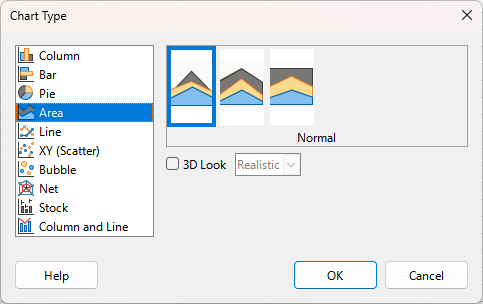
On the other hand, your P.S. (or, rather, something resembling it) would require to use Area type:

image

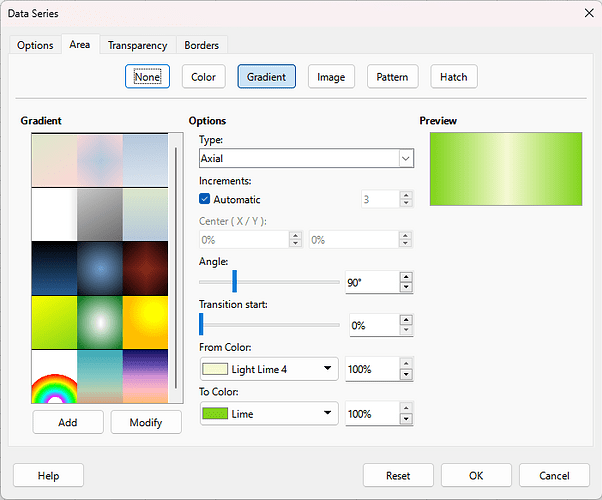
and use the area gradient fill:

With the work on multicolor gradients in version 7.6, it would allow to do exactly what you need, by specifying the points of color transition exactly in the gradient; but unfortunately, the UI is still not implemented.