Hello,
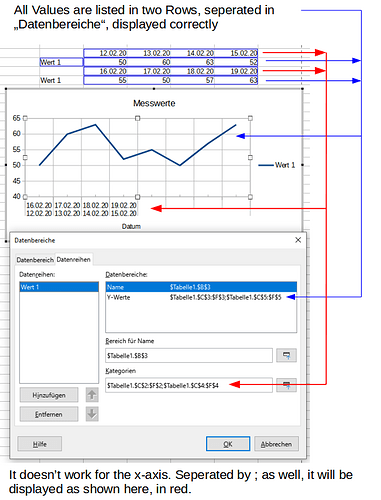
I have in a very simple Calc sheet a format Issue. I have visualized it with a picture. The Valus are in more than one Row. It works for the Values itself, but it doesn’t work on the x-Axis. I have tried a lot of format things, but no solution.
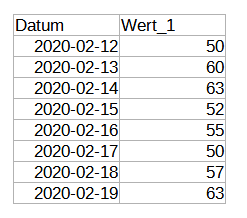
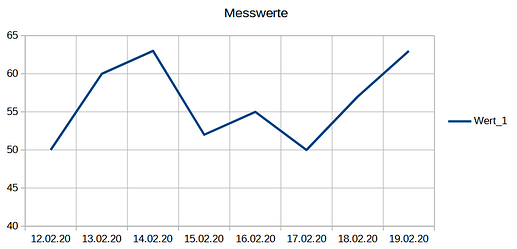
If I write down all valuees in one row, insted of two, it works correctly.
Hi Pschloth. Generally it is better to post an upload of a stripped-down version of your spreadsheet than to post a picture. That way anyone can jump right in and test ideas without having to recreate an example.
Generally there is no reason to have the same dataset broken up into two different rows. But if that is just necessary, you can get from what you have to what PKG is suggesting with a small macro that just iterates through both data chunks and returns one big array. To use this sort of User Defined Function (UDF) you enter it with the correct source chunk ranges as a CSE array function…enter with ctrl+shift+Enter instead of just Enter, which puts in the { } around it that you see in the sample spreadsheet (ODS).
You can copy and paste the macro into your ODS using Tools>Macros>Organize Macros>Organize>New and accepting Module1, then Tools>Macros>Edit Macros, double-click your way from your spreadsheet name to Standard to Module1 in the tree at the left, and paste there.
Union Broken Data.ods (19.3 KB)
Please always attach a relevent example file in such a case.
Images are of very limited value (often no value at all) if not the question is explicitly about an issue with the view. In your case the problem is related to the structure of the sheet, and the usage of data ranges for a chart. If you provide an example, you can place additional explanations therein, and in many case you may get an answer with an attachment demonstrating the suggested solution.
(An example is already attached now to the comment by @joshua4.)
One sheet for the raw data (more than one if needed).
One sheet for calculations, reorganizations (rows/columns) and probably comments on the solution. raw data (More than one if needed).
One sheet for the presentation (“prettyprint”) (more than one if needed).
suggestionUnionBrokenData.ods (23.5 KB)
My example sheet was part of a comment strictly based on recreating PKG’s idea as it appears in the snapshot–no grid lines, with data in a column, etc.
I suppose you could also use two TRANSPOSE()'s spaced properly, etc., to replicate PKG’s suggestion. [Edit: Not blaming PKG, just noting that my comment was entirely a follow-on.]


