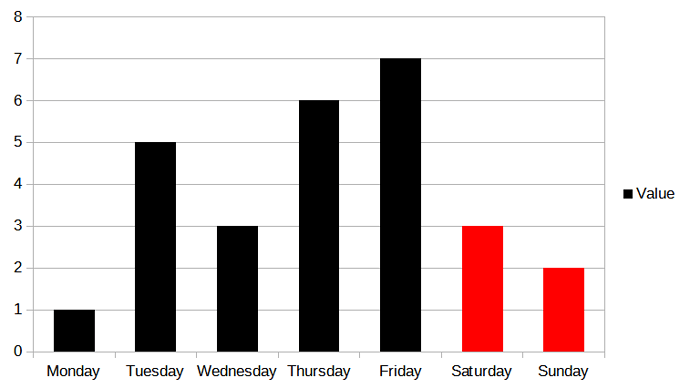
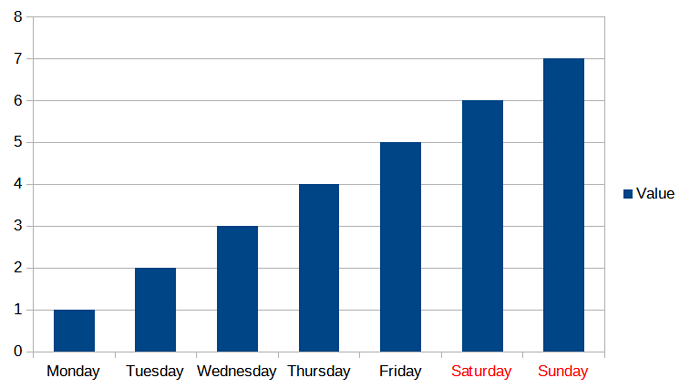
My graph is based on a normal excel chart. The categories are either black or red depending on their value. They are weekdays. Mon -Fri are black and Sat-Sun are red.
But when these values are shown in the graph axis they are all black. Even when I click the box “Use source format”…
Have I missed something?
Hi Lars, I just assumed you were talking about a bar chart like this:
A category or data series first has one colour. To change individual data points, you must edit them individually and change the colour. When you have clicked on the data series, click again on a bar or data point. Now you can select Format Data Point in the context menu with the right mouse button and change the colour there.
I hope this has helped.
Thank you!
I know how to change colors in the graph. But I want the words Saturday and Sunday on the category axis to be red! These two words are red in the chart where data is recorded but get black in the graph! I think it should have the same formatting on the axis as in the chart.
Lars
Hello @Lars_Rantila, I had misunderstood you at first. The possibility of using the source format does not refer to direct formatting. So it doesn’t work like that.
However, I have a workaround for you that is very simple and productive.
I used the numbers 2 - 8 for the category column instead of the names “Monday - Sunday”. Why is that? If you look at the result of =WEEKDAY(2), “Monday” comes out here. The date 1/1/1900 is Calc internally a 2 and that was obviously a Monday.
Now you can add the following format code to the cells (with 2 - 8):
[RED][>6]DDDD;DDDD;DDDD
Now the Saturday and Sunday are formatted in red and this can then also be seen in your graphic.
My example file is attached:
Weekend red.ods (19,3 KB)
I hope this helps you.
I am amazed of the skill out there!!
This is more than I could imagine! Thanks a lot !
Lars


