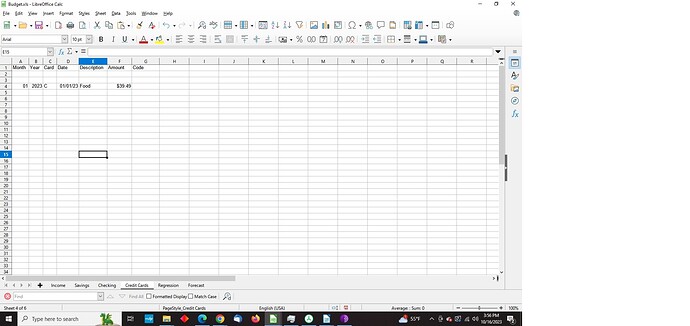
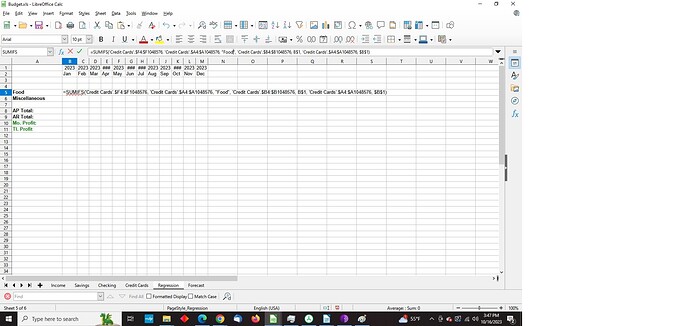
My budget consists of 2 sheets named “Credit Cards” and “Regression”. I am trying to show my data from the “Credit Cards” sheet on the “Regression” sheet to show how much I spent in the past for each item or service.
The “Credit Card” sheet lists each item horizontally. Column A = Month, B = Year, C = Credit Card, D = Date, E = Description (i.e. product or service) and column F is the Amount.
The Regression sheet lists each item vertically. Column A = Description (i.e. product or service), Row 1 = year, Row 2= Month (i.e. B2 = Jan, C2 = Feb).
I need a formula to show the amount related to the product or service description in “Credit Cards” to show on “Regression” in the correct location only if the year, month and Description match.
Thus far, I’ve been able to refine it to the following:
=SUMIFS(‘Credit Cards’.$F4:$F1048576, ‘Credit Cards’.$A4:$A1048576, “Food”, ‘Credit Cards’.$B4:$B1048576, B$1, ‘Credit Cards’.$A4:$A1048576, $B$1)
Since I’m beginning the new year with a complete budget overhaul, I would also be open to other suggestions / templates.
Images:


