How can I format the numbers of the Y-axis? (see screenshot for better understanding pls, thx)

Hi,

so if you take a look at the screenshot below, my problem is how the 0s are being grouped. This isn’t a problem for most of the y-axis numbers, but the 750k at first glimpse looks more like a 75k. The other numbers also look a bit weird, though, with the two rightmost 0s being grouped a bit apart from the rest of the same number.

Is there a way to format these numbers so that instead of “75 0000”, it looks like “750 000”? I kept looking around, but couldn’t find anything. Thanks for any help!

(embedding doesn’t work apparently, but if you click the “broken” image, it loads just fine in a new window)

They are not grouped. This is a non-subpixel text layout, where each glyph starts at a whole pixel boundary; this is an artifact of rendering. E.g., 500000 similarly looks like
50000 0.

Ok thx, but how can I change it? We agree that it looks odd like that, right?

Easy: you fix the code :wink:

I don’t understand that reply. Sorry if I did anything to offend you, but I really need help with this, no someone telling me to learn coding just for having a number be displayed properly. :confused:

Nonono :slight_smile: it was just to tell, that this is an internal defect, and there is no “stop doing silly things” secret configuration.
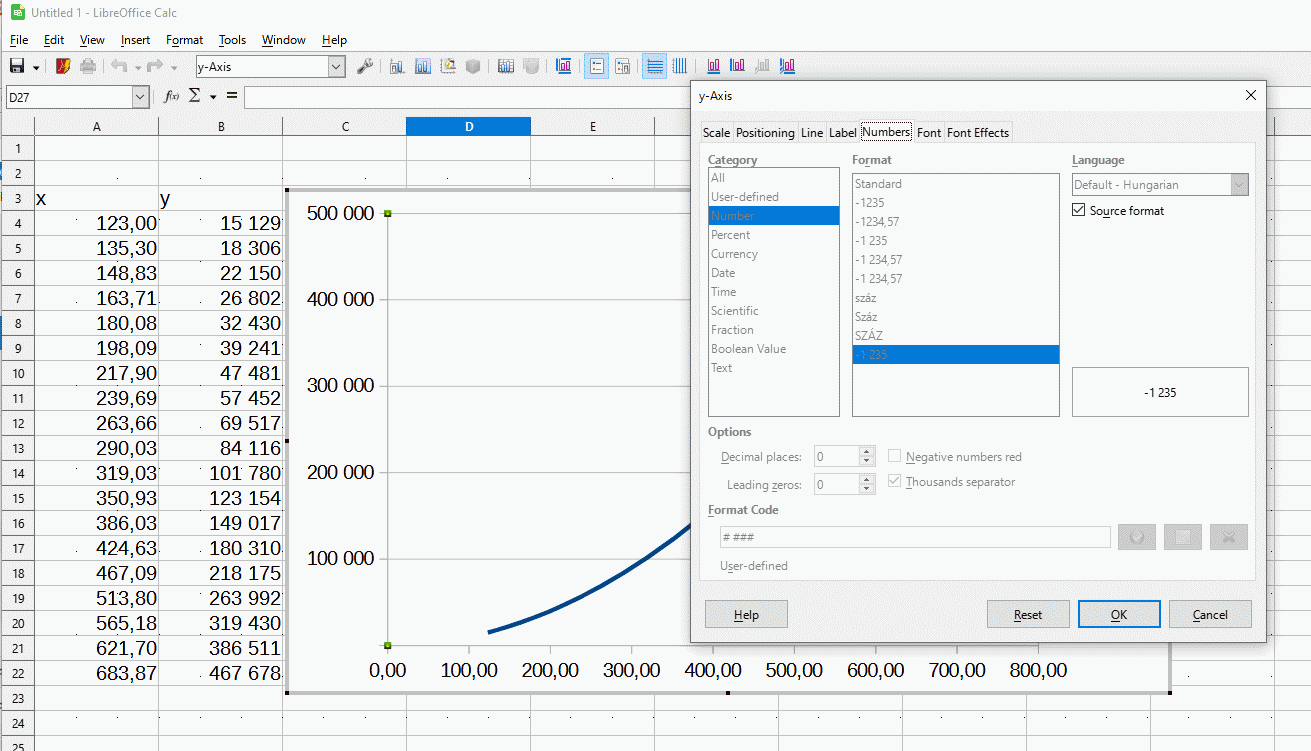
Ok, thx. So there literally is no way to display these numbers correctly with LibreOffice Calc? Wouldn’t this be highly unprofessional in a graph for work? This one isn’t, so it’s not that bad, but still?

There is a problem. But what is your point here?

I’m sorry, are you trolling me?

No. I just don’t see what point you are trying to make. E.g., you can intend to say, “It’s highly unprofessional, go and fix it”. The “isn’t it unprofessional?” question makes no sense by itself (and even doesn’t clarify, which professionalism is under review, the one of LO developers, or of the user…)

Do you need to share screenshots or printed copies of the chart?
Have you tested to change the zoom level?

You can set the label formats of the axes to the “source format”.

Use some custom cell styles to format the data for the axes.

SourceFormat.ods (22.2 KB)

2 Likes

Thanks a lot!
While it wasn’t the “source format” option, your example file helped me figure out that it was the “decimal places” and “thousands separator” option below in combination with the “decimal numbers” category. That worked!