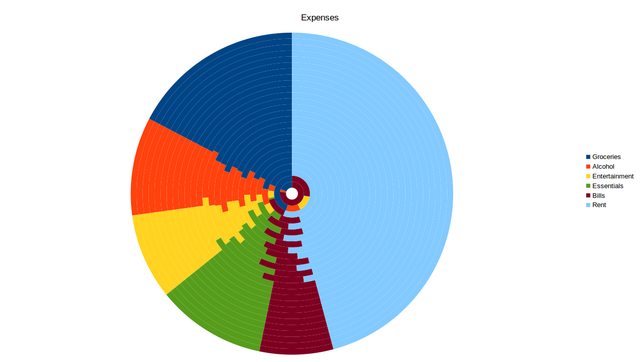
I’ve got a chart that looks like this:

I want to change the colours, but the only way I can find to do that is one segment at a time (ie. changing each of the 156 pieces individually). Surely there’s got to be a quicker way? Some way to make “groceries” green instead of blue all at once?
Secondly, how do I change where the “alignment” falls? Like, currently groceries and rent are lined up with each other but I want Alcohol and Entertainment to line up instead.
I’ve got the data series in rows, if that changes things.
(edit: activated chart pic)


