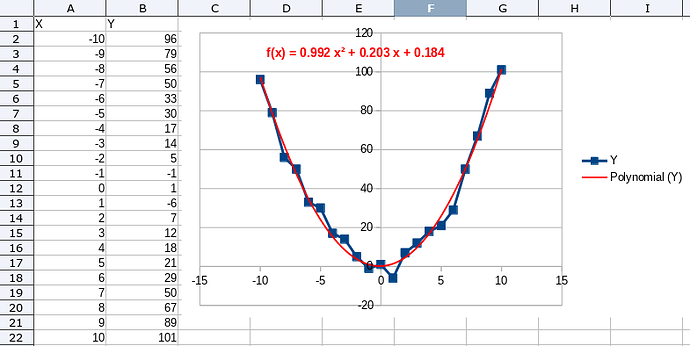
I have created a graph, working in calc
Edit your question to explain your goal. A graph is not a mathematical object.
What do you want? A polynomial which minimises some distance between the polynomial and your data at the sample points (e.g. minimising the sum of squares)? In this case which is the degree of the polynomial?
What is your skill in maths?
Hello,
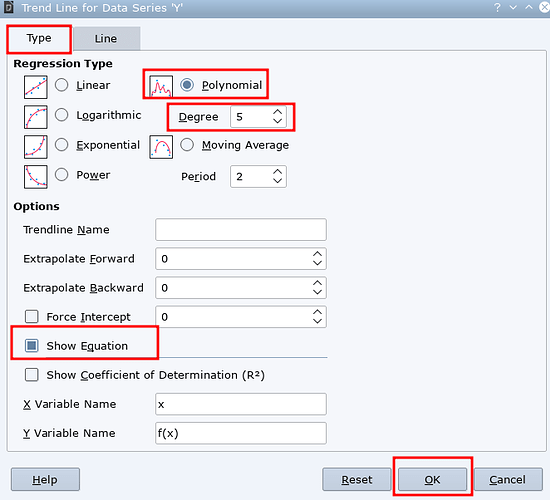
- Select the data series within your chart by clicking one of the data points
Right click -> Insert Trend Line ... -> Tab: Type- Select option
[o] Polynomialand specify the Degree - Select option
[x] Show Equation - Click
OK
##Sample##
(after some formatting of trend line and trend line equation for degree=2 polynomial)
Calculating Polynomial Coefficients##
You may use function LINEST() to calculate the polynomial coefficients. To see how this works, check the following sample file:
Hope that helps
An X-Y (Scatter) Chart [what comes next to what often is called a “graph” in mathematics or a “diagram” in many contexts] may show values (ordinates) belonging to a sample of abscissae. In this case we may assume the values to be approximately the values of a mathematical scalar function of one scalar (real) variable. Expecting this function to be polynomial of a given degree, we can order the software working behind the Chart, to estimate coefficients for the supposed function, or, in different words, to calculate such coefficients minimizing the result of a specific evaluating function concerning the aberrations.
In fact this is what must be done if a polynomial Trend Line shall be inserted.
For the purpose the Chart software will use a widely applied mathematical method, and offer to also show the calculated coefficients in an additional object added to the chart.
The exactly same method is implemented by the function LINEST(). You can therefore get the coefficients without writing them off the mentioned object. However, you don’t only need the abscissae themselves, but also their powers up to the chosen degree as the exponent.
If you urgently need coefficients for polynomial approximations often, I can provide (raw) user code (in Basic) calculating them without relying on helper columns or charts.


