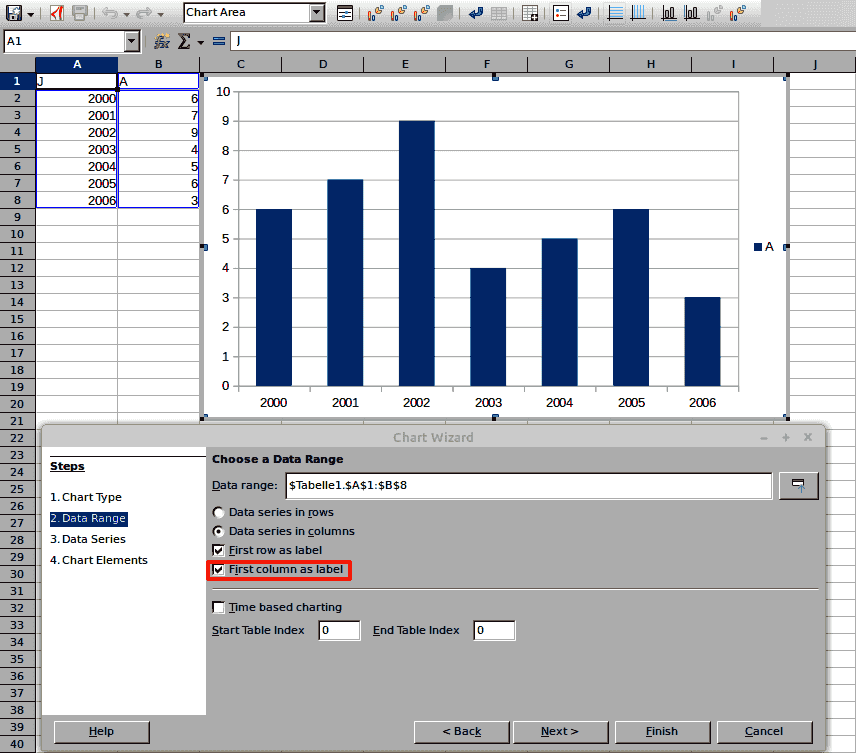
I cannot figure out how to make the x-axis the year for each value in a bar chart! I got the legend to show all the years with color dots, but I can’t get the years along the x-axis Deaths and Mortality Rates UK
Thank you so much, Grantler. Still working on making it look prettier and striking. Thanks again

