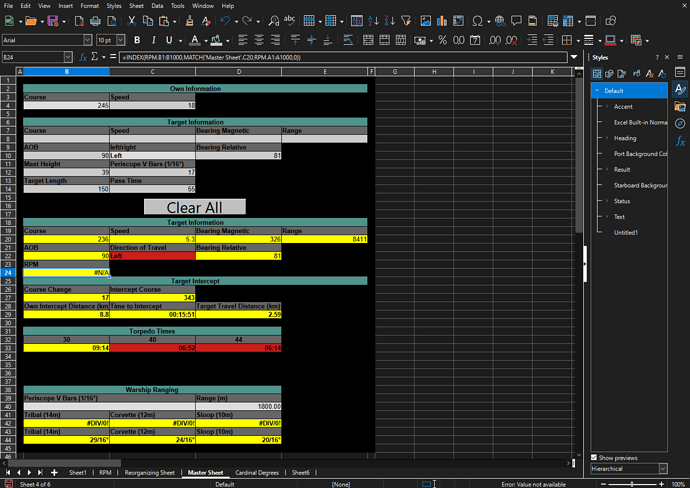
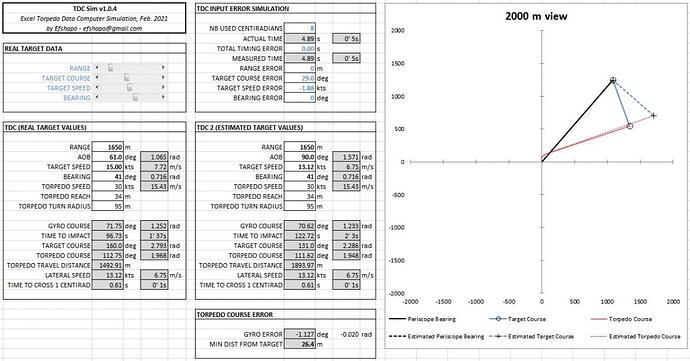
The “Sliders” are called “ScrollBar” in LibreOffice. You find them in the tool “Controls”. That is not visible in the default settings, but you can add it to a toolbar or menu using Tools > Customize. You need the command “Controls” (.uno:Config) from Category “Controls”. After you have inserted it you will see a little triangle at the icon. Click on the triangle to open the float-able window of the “Controls” tool. The icon “ScrollBar” is the last one in this window.
When first time inserting such control, it is in edit mode. In edit mode you can use the control properties (from context menu) and set the minimum and maximum value in tab General. When you insert such “ScollBar” control in Calc, then you can connect it to a cell using the tab “Data” of the control properties. When you save and reopen the document, the control is no longer in edit mode but now you can drag the slider to change the value. At any time you can toggle the mode using the icon “Design Mode” in the Controls tool. It is the second icon there.
Slider.ods (16.6 KB)
The attachment has linked the “Scrollbar” control to cell A2. Changing the value in the linked cell manually, will move the slider, and the other way round, dragging the slider will change the value in the linked cell. I have put the control in front of the linked cell to indicate, that I want that the user drags the slider and not manually edits the cell value.
I do not understand your question about the chart. You should write a separate question for it.


 ), no sure either what’s your problem with adding a chart ?