How to create a "resource usage" graph

I have a data file with 3 columns: resourceId, startTime, endTime
An entry in this file indicates that a resource was used between startTime and endTime
For example I have data like
|R1|02:00:00 PM|03:00:00 PM|
|R1|04:00:00 PM|05:00:00 PM|
|R2|02:00:00 PM|03:00:00 PM|
|R2|05:00:00 PM|05:30:00 PM|
Now I would like to create a graph containing a line for every resource.
The X-axis starts at the lowest startTime and ends at the highest endTime
The Y-axis contains the different resources

The [start-end] time windows of the line where the resource is used should be coloured.
For example, the line for R1 should start at 2 and end at 5:30 and should be coloured between 2 and 3 and between 4 and 5

Is it possible to create such a graph?

Welcome.

Someone may see how to do it basically directly by using existing charting. But it seems like it may come down to a stacked bar chart after preparing a second table of values to define the bars.

Is there the option of using macros?

Just in the name of not reinventing the wheel, have you looked at the GanttProject? I believe it is free and open source.

Thanks for your input! Generating additional data might indeed be the way to go!
Using macros is definitely an option.
Thanks for the GanttProject reference.

Study the attached example
disask109494_VisualiseResourceUsage.ods (324.3 KB)
and ask specific questions if some are open.
You may comment on my answer for the purpose.
Please attach a .ods containing a realistic example next time.
= = = Edit 2024-08-18 about 20:00 UTC = = =
Suddenly this reminded me of a completely different approach directly using small colored sheet cells (based on styles) as a kind of surrogate for ghraphical elements. I designed that many years ago, but never used it for myself since.
See new attachment:
disask109494_VisualiseResourceUsage2.ods (79.2 KB)
= = = /Edit = = =

2 Likes

Thanks a lot!

I edited my answer above.

I now fully understand how to create the additional data columns. (I’m still analysing your first approach)
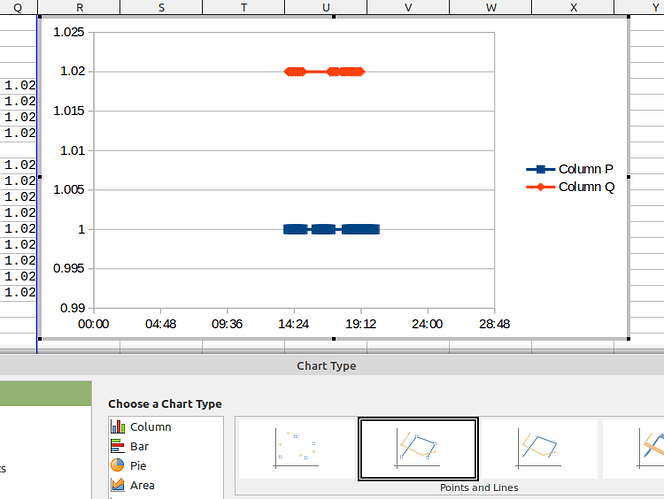
I still have one problem though: when I create the XY scatter plot, based on the example data, I always see a full line from the first till the last point, no gaps in between while your graph clearly shows the gaps.
When I use “points and lines” the points are indeed at the correct position (see image) but the line seems to be continuously. How can I avoid this?

The Chart shape has an inner (diagram) area where you can select the series (a line in this case). For such series the context menu has an item Format Data Series. It opens a dialog with a tab Options. >> PLot Options. You see?

Found it! Tx a lot!
I also looked at your second approach which is also a pretty nice/creative visualization!
Thanks again for helping me out. It’s appreciated!