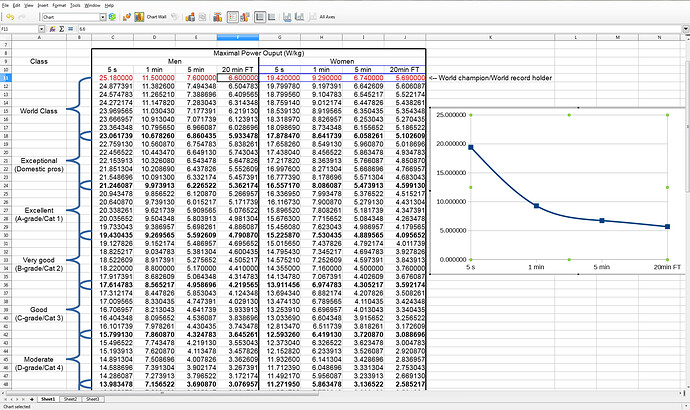
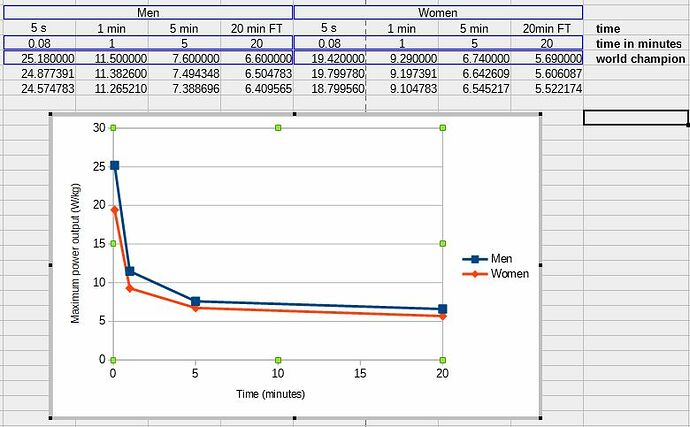
I have data from 5s, 1min, 5min and 20min. I need to put it on a point and line chart. The problem I’m having is the time value is being reflected as sequel intervals and that’s not what I’m looking for.
It is not clear what you are looking after. Do you want other values on the x-axis?
The values should be numeric. So, convert the times to minutes. (Alternatively, use seconds as in 1 minute = 60).
The file: chart domain from 0 to 20 minutes.ods


