Hi!
I use LibreOffice 6.3.4.2 in Ubuntu Studio 19.10 (64 bits Linux).
I made a Calc spreadsheet with the standard values of the Atmospheric Pressure according the Altitude over the sea level.
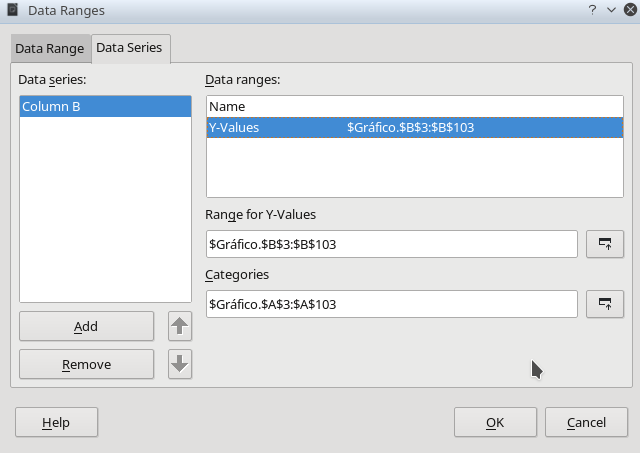
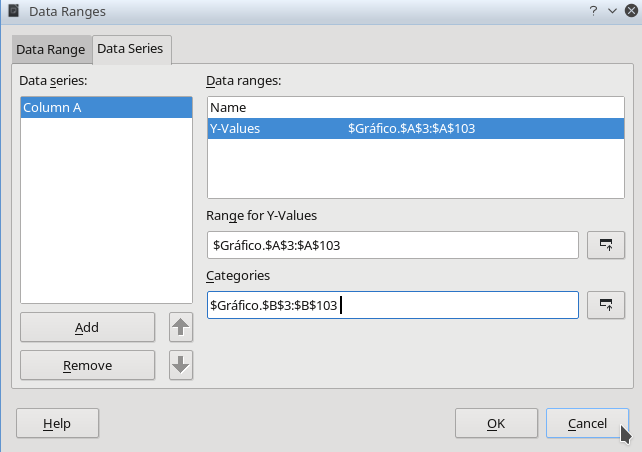
I put the Altitude values (meters) in the first column A. I put the Pressure values in the second column B.
I get a very nice graphic (as you can see in the attached file), BUT…
I wonder… How can I interchange the axis values? I mean… To put the Altitude (meters) in the Y axis, and the Pressure values in the X axis.
How can I get this?
BTW: I think this option should be present in the first steps of the Graphic Assistant. Just an idea.
Variación de la Presión Atmosférica según altura sobre el nivel del mar.ods


 ) next to the answer.
 )
)