How to properly filter by date in a pivot table?

I have a pivot table with dates in column A (properly formatted as dates) and a quantity x in column B. The dates go back to 2016, but I want to create a graph with the data from 2021-now.
This means I want to filter the dates like it is usually possible, for example in the data source (another sheet). See this image: https://1.bp.blogspot.com/-UbfD2YVaZ-Q/XeAndgBX_mI/AAAAAAAABLw/FglgsyX3sY4inF099WeMYg9OOGHfRw_9QCNcBGAsYHQ/s1600/Autofilter%2Bwith%2Bmonths%2Band%2Byears.png

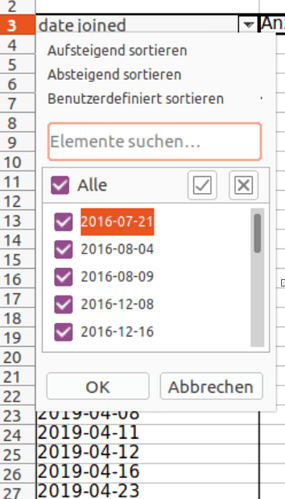
In the pivot table, I can only filter by selecting day for day.

How can I filter dates as dates in the pivot table? Alternatively, how can I change the data range of the graph built from the pivot table? This doesn’t work for the graph created from pivot table: How to adjust a x and y axis ranges on a chart created in Calc

If you need monthly results:
Click any date cell in the pivot
menu:Data>Group>Group [F12]
Group by month and year.

Pivot_Mont_Person_Category.ods (88.3 KB)

I created two pivot tables on the same data and tried to apply grouping to only one of them, but both are grouped. Why is that? How can I avoid this?

https://bugs.documentfoundation.org/show_bug.cgi?id=153217

1 Like

Thanks for reporting this!
I saw that this happens in Excel as well, it’s due to the Pivot cache: Change One Pivot Table without Affecting Other Pivot Tables - YouTube One way around this is is to set the ranges of the two pivot tables differently, i.e. adding one line or column.

Okay found it :slight_smile:
Right-click on the pivot table, filter, set “date < 2021-09-01”. Previously I had just tried “2022” without setting the month and day, that doesn’t work.

2 Likes