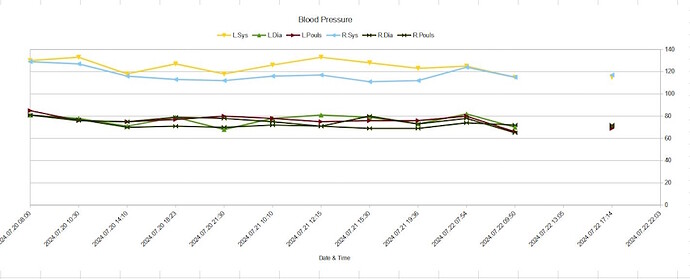
How to put the y-axis labels to the left of the chart and how reduce the y-axis scale from 0-140 to 50-140

This post follows on from my previous, which has become very messy! (my lack of understanding)
Previous post

With help, I have created a chart which does most of what I want to see:

However,
Is it possible to have the y-axis labels at the left?
and
Is it possible to reduce the scale of the y-axis to be 50-140 rather than the default of 0-140? I would hope that this would then expand the cluster of lines around the 80 mark.

Thank you.

  • Double click the diagram to put it in “edit mode”
    • Edit mode is signified by tiny black “drag handles” on the edge, instead of the usual color filled squares.
  • Point mouse pointer exactly on the Y axis
  • Right click and select to format axis.
  • Select the Scale tab
    • At the minimum value field, untick “Auto” and set your value
  • Select the Position tab
    • Select to cross other axis at start

Thank you very much keme1, your advice was exactly what I needed!

The only change I had to make was to choose cross axis at ‘end’ not ‘start’