OpenSuse 15.2
Calc 7.1.4.2
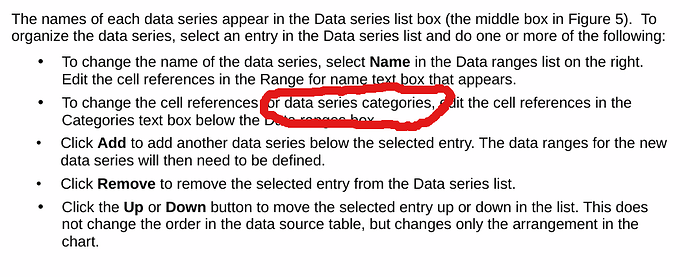
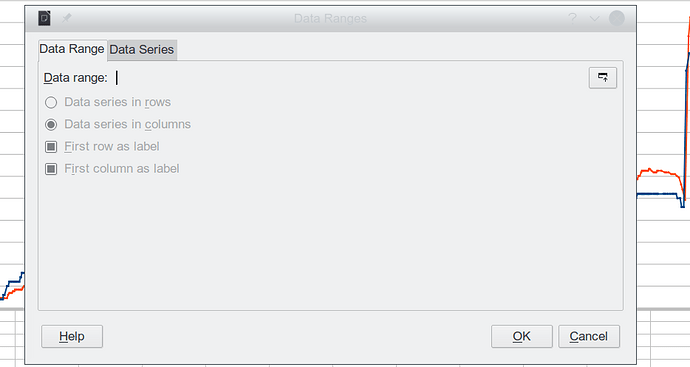
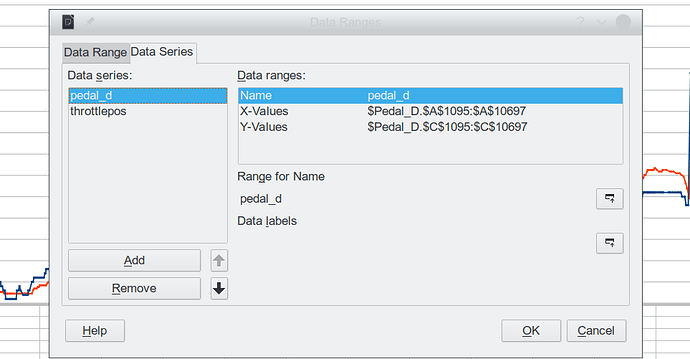
I’m afraid this could be viewed as kindergarten stuff. But as somebody who just wants to chart a series of values, ideally using a “ScatterChart” to associate the X with the Y value, I’m finding these concepts fall all over each other. Eg., apparently DataRange conflicts or subordinates to Series because when editing Series from the chart, DataRange reverts to null. And having partly defined a chart with X and Y axis, using a single Series, I have absolutely no idea what Category might mean… I see no use for that term and after an hour of searching I find explanations that all seem to overlap each other. In order to use the chart dialogs, it would help a LOT to have these terms/concepts clearly defined including how they relate to and affect each other.
Thx for any thoughts.
Rufus


