Libre Office broken graph rendering

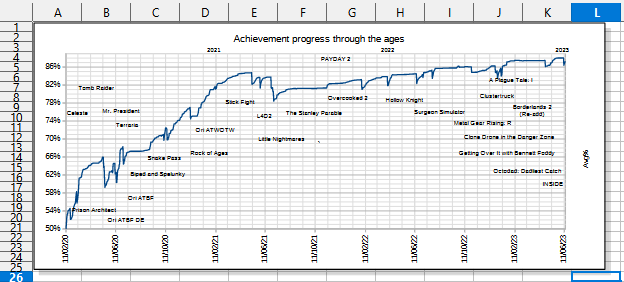
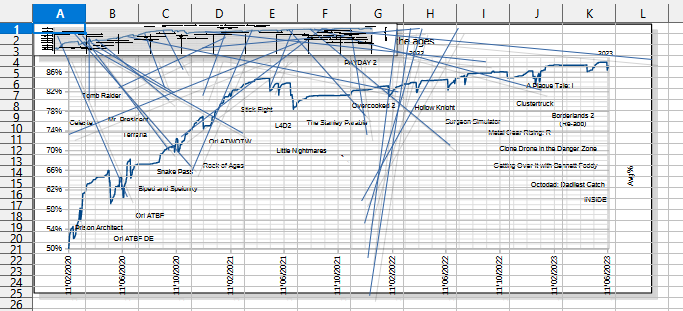
I’ve had this graph in one of my sheets for years, but one day it got vertically compressed, and nothing could fix it. When I try editing it, it fills an entire screen’s worth of a sheet, like it used to, but escaping turns it back into a compressed mess. Below is an example of how it looks on my Linux machine:


The issue seems to be OS, graphics card, ram capacity, Libre Office version and screen size (and thus GUI size) agnostic, as I have the exact same issue in both of my machines that are different in those departments. Below are their specifications:

Linux Machine:

OS: Linux Mint 21.3 Cinnamon 6.0.4
Graphics Card: Radeon 6700 XT
RAM Capacity: 32 GB

Libre Office Version: 7.3.7.2 / LibreOffice Community
Build ID: 30(Build:2)
CPU threads: 12; OS: Linux 5.15; UI render: default; VCL: gtk3
Locale: en-US (en_US.UTF-8); UI: en-US
Ubuntu package version: 1:7.3.7-0ubuntu0.22.04.7
Calc: threaded

Resolution: 1920 x 1080
Size: 24 Inches

Windows Machine:

OS: Windows 10
Graphics Card: GeForce GTX 1050 mobile
RAM Capacity: 16 GB

Libre Office Version: 7.4 up to now

Resolution: 1920 x 1080
Size: 15.6 Inches

Link to original Reddit post that reports the original appearance of this bug:
https://www.reddit.com/r/libreoffice/comments/10b58go/after_updating_to_libre_office_74_from_70_with_a/

At first I didn’t pursue this bug any further, but I have recently learned that I wasn’t the only one with this issue so I have reasons to believe that this is a reproducible bug.

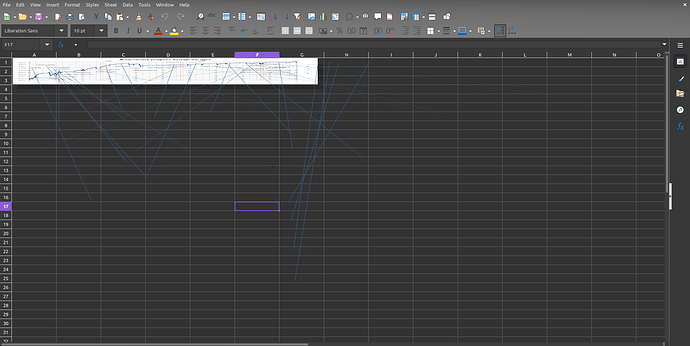
can you share the .ods file, maybe after removing all confidential information?

Bugged Calc.ods (138.9 KB)

Here’s the sheet with most components unrelated to the graph removed

Don’t know why, but there are something wrong with the svg: values of the connecting lines: some negative values, some greater than the chart height or width.

This is the last one in the content.xml subfile iin the Object 1 subfolder or your document:
svg:x1="27.333cm" svg:y1="1.657cm" svg:x2="24.363cm" svg:y2="94.344cm"
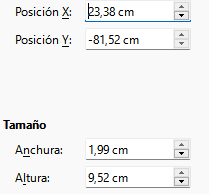
In the screen shot of the left, it is the blue one that almost reaches 100, but not shure if is the one that show these values in chart edit mode (anchura is width, altura is height):
{377A96E7-88F8-477B-AB62-5CE8D1543C20}

I don’t know how these lines must be. Maybe the values can be reduced proportionally in the subfile, or just select each lline, F4, and change its size.

XY lines values.ods (32.1 KB)

Hi,

I have used this macro to remove all lines in the chart object

Sub RemoveLines

oSheet = ThisComponent.Sheets.getByIndex(1)
oChart = oSheet.Charts.getByIndex(0)

oChartDrawPage = oChart.EmbeddedObject.DrawPage

for k=oChartDrawPage.Count-1 to 0 step -1
	oShape = oChartDrawPage.getByIndex(k)
	if oShape.ShapeType = "com.sun.star.drawing.LineShape" then
		oShape.Parent.remove(oShape)
'		xray oShape
	endif
next k
End Sub

By hand I also removed an image.
I believe this is a bug in LibreOffice, but without knowing the history it is very difficult to reproduce and file a bug report
I believe we can exclude that the Graphic Card or the OS play a role here
Good luck,
ms777
Bugged Calc-repair.ods (123.1 KB)

This means that you have edited the original document, and saved it again. In the process, the problem of the incorrect loading of the data has made its job, and you saved the already-damaged graph; now we can’t see the original, unchanged graph, even using an old program version that used to show it correctly…

Hi,

I have created a minimum sample which is able to reproduce one part of the problem.

In the attached ods I have inserted a line into the chart, with Position X = 4", Position Y = 1", Size Width = 1", Size Height = 1"

If you use the UI to increase the line size by 10x, which would be far outside of the chart, it is not possible. If you enter too high numbers for width or height the value is not accepted

If you use the below macro to increase the line size by 10x, it is possible and reproduces the effect that the chart looks different when activated or not.
If, after running the macro, you edit the line through the UI you find a width of 2.29" and a height of 2.54", not 10" as expected. Position is -3.71" / -6.46" and unchangeable. If you change height and width back to 1", automagically the position goes back to 4" / 1"
Same behavior on AOO, just here the position goes back to 0" / 0"

Kind of funny … but I am not sure, if it is worth filling a bug for that.

ms777
Chart with line.ods (17.0 KB)

Sub Main
oSheet = ThisComponent.Sheets.getByIndex(0)
oChart = oSheet.Charts.getByIndex(0)

oChartDrawPage = oChart.EmbeddedObject.DrawPage
oChartLine = oChartDrawPage.getByIndex(1)

oNewSize = New com.sun.star.awt.Size
oNewSize.width = 10 * oChartLine.Size.width
oNewSize.height = 10 * oChartLine.Size.height

oChartLine.size = oNewSize
End Sub

A bit of a clear up:

The problem isn’t the lines, they are a bit wonky, but that’s because the graph was being updated constantly so they are out of date. The problem is the changing size of the Graph object itself.

…the lines wrong size.
See what happens when the lines were removed one by one with click and Delete or Tab* and Delete.
{0B43BAC2-22DB-4AE5-90E9-DDC08EBF5627}
*There are a few lines that are not shown in the chart frame, so, there is no way to click on them.


Both charts, with or without lines, occupy the same size:
{58E96AE5-A96A-4435-9E45-E11BD31F1CF3}

I’m afraid the chart was rotten (next to) beyond repair.
In such a case I would always recommend to create a new one from scratch.
Starting to do so a user should reconsider the fundamental design.

  • If data are next to equal (like Avg and Expected in the given example) they can’t be reasonably shown in the same diagram. The difference should be calculated and displayed.
  • Data that are different by orders of magnitude (in the example by factors of about 50) can’t reasonably be visualized on the same scale/axis.
  • However, charts with two y-axes can also become a nightmare. There isn’t a tool that can visualize everything of interest on a few cm^2.

I tried what I thought was possible:
Reconsidered_Charting.ods (173.2 KB)