Thank you — was just about to think of a new Q to post, but for now …
I already saw the ChartsInBase.ods (also cheers!) - really useful method, but hard to customize for publication-style diagrams - but that’s what Calc is for right?, - to clarify:
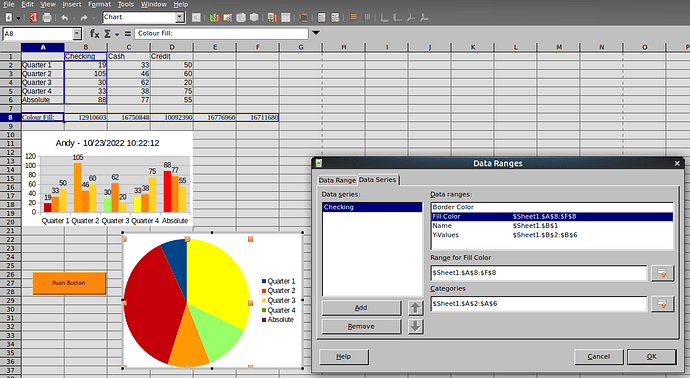
I actually was working with PieCharts, which can have a Fill Color range specified as a range in the Edit GUI - I modified the original macro code to work with a single data-ROW + label-ROW :
The broad workflow here is to generate batches of ‘similar data’ to dump in Calc, each of which produces subsets of related Charts. The charts are pre-made templates that (ideally) just need their data-ranges adjusted for each batch. Macros are intended to directly replace manually adjusting data and other ranges in the Edit GUI.
Blockquote
Sub SetRanges
  oSheet=ThisComponent.CurrentController.ActiveSheet
  oChart = oSheet.getCharts().getByIndex(0)
  oData = Array(oSheet.getCellRangeByName( "A1:E1" ).getRangeAddress(), _    '<< defaults to label in new chart
              oSheet.getCellRangeByName( "A2:E2" ).getRangeAddress(), _  '<< single data series in row
  '>>           oSheet.getCellRangeByName( "C1:C5" ).getRangeAddress(), _
  '>>           oSheet.getCellRangeByName( "D1:D5" ).getRangeAddress())
 oChart.setRanges(oData)
End Sub
Blockquote
This works as a basis to update Pie chart data ranges (data from Base query), but I wanted to retain the custom color schemes (linked in Base to hexi-color codes) as well - subtle database-wide control of color is needed for final images in this project - currently, such ‘properties’ are reset to default when using the macro…
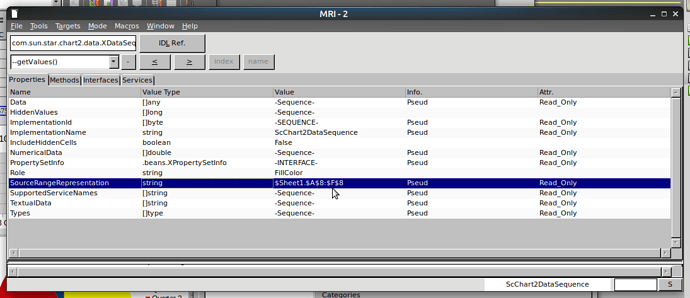
I thought it should be possible to define the ‘Fill Color’ range in the macro body somewhere, but the vocabulary, grammar and syntax for this evade me.
I see that ONLY Pie Charts have ‘Fill Color’ option in GUI, so no star::Diagram(etc…or similar…) related ‘FillColor’ properties for Line or other types, so maybe just point/line colors for Pies ?? ? …
I have also found Interface XColorScheme
but not sure what to make of that yet 
Of course setting Pie Charts by hand is not such a huge task (sigh), but a generic solution could also be applicable to e.g. ChartsInBase method … which could very useful.
As always, your thoughts are welcome 
PS: the other solution here (by mark_t) works very nicely to modify the vertical range of a chart template in Calc to the actual data dumped to the sheet (taller or shorter), but I can not really understand how it works at all > let alone adjust to work with row-series and PieCharts … so, if needs be, I will default to some mix of this and manual adjustment in Calc
PieCharts in base forms with customizable FillColors would remain a ‘nice-to-have-but…’
(and, for reference, just saw FillColor in this: Interface XGraphics)


