Hi,
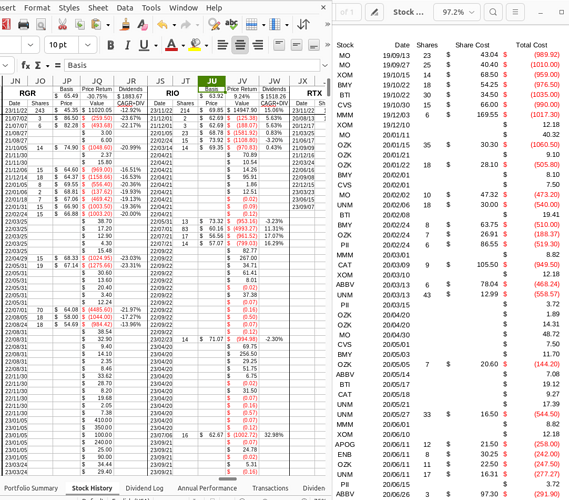
I’ve created a workbook for tracking stock portfolios. On one sheet I have a transaction list (Transactions) containing the stock ticker, date of transaction, shares, share price, and cost. This makes it very simple to take a digital history from a financial institution and import into the spreadsheet. On another sheet I have each individual stock with the transactions for that stock only (Stock History). I also do some calculations on the data for each individual stock.
So I currently have this functioning by using an array formula that scans the entire list of transactions and when it finds a row matching the stock at the top it copies it down and moves on. There are a couple of issues with this. First, the array formula goes through the entire list of transactions for every single stock. For a small portfolio, this is not a problem. However, I’m working on one with over 2000 transactions and counting with 65 holdings so the array formula takes a significant amount of time to update (more than 5 minutes). The second issue is that in the individual stock sheet where the array formulas are running, there are only 10 rows of data every time the sheet is re-opened. Because of the update time, I’ve been saving the file with autocalc > off so the file can be opened without waiting for it to update. However, all of my calculations on the data are wrong because data is missing so I have to turn on autocalc then do a recalculate hard command to get it to update the arrays.
I looked into using the advanced filter with copy function which I can do and then do a data > refresh range to update, but it is only good for a single filter as far as I can figure out. If I can use the advanced filter for 65 filters on the same data and be able to do the refresh option when new transactions are added that seems like it would be ideal.
Is there a better way to do this?
Here is the formula I use to “filter” the stocks:
=IFERROR(INDEX($Transactions.$B$5:$Transactions.$E2110,SMALL(IF($Transactions.$A$5:$Transactions.$A$2110=JS$1,ROW($Transactions.$A$5:$Transactions.$A$2110)-MIN(ROW($Transactions.$A$5:$Transactions.$A$2110))+1),ROW($Transactions.$B$5:$Transactions.$E$2110)-MIN(ROW($Transactions.$B$5:$Transactions.$EE2110))+1),COLUMN($Transactions.$B$5:$Transactions.$E$2110)-MIN(COLUMN($Transactions.$B$5:$Transactions.$E$2110))+1),"")
Here is an image with the transaction list on the right and the filtered data on the left. Sorry I can’t upload more than 1 image due to new user restrictions.
Version: 7.3.7.2 / LibreOffice Community
Build ID: 30(Build:2)
CPU threads: 4; OS: Linux 6.2; UI render: default; VCL: gtk3
Locale: en-US (en_US.UTF-8); UI: en-US
Ubuntu package version: 1:7.3.7-0ubuntu0.22.04.3
Calc: threaded
Thanks,
Paul

