Not displaying x values in data labels categories, but the ranks of the points instead

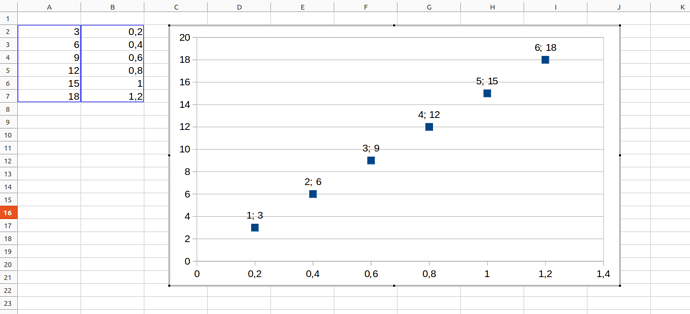
On a scatter plot, I want to show both x and y values in the data labels. I tried checking “Show categories” in the data label editing window to display the x values, like it was advised in another topic, but then it shows the rank of the point (1,2,3…) instead of the x values.

Version: 7.6.4.1 (X86_64) OS: Linux 6.5;


scatter_plot.ods (18.1 KB)

Please upload a real (.ods type) sample file here. We can not check the applied settings on a picture.

I uploaded a sample file. Thanks!

Hallo
Maybe »Line«-Chart instead »x-y« ??

line_plot.ods (17.8 KB)

Thank you, this worked to get data labels with x values. But I realized that other things in line-chart are now inadequate for what I want to do :

  • The spacing in the x axis is weird, it does not match the spacing between the label values
  • The linear trend line equation is wrong
  • All data series seem to need to share the same categories or x-values. I need to have many data series with each there own x values.

Is there any way to get data labels displaying x values in a scatter plot? Or a way to solve the problems mentioned above in the line chart?

sample file.ods (20.0 KB)

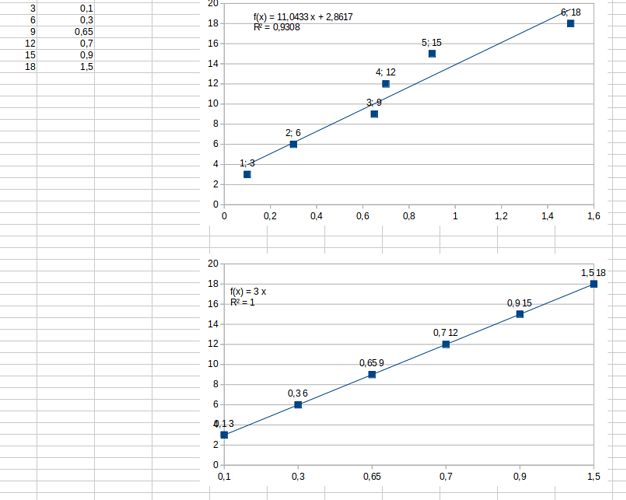
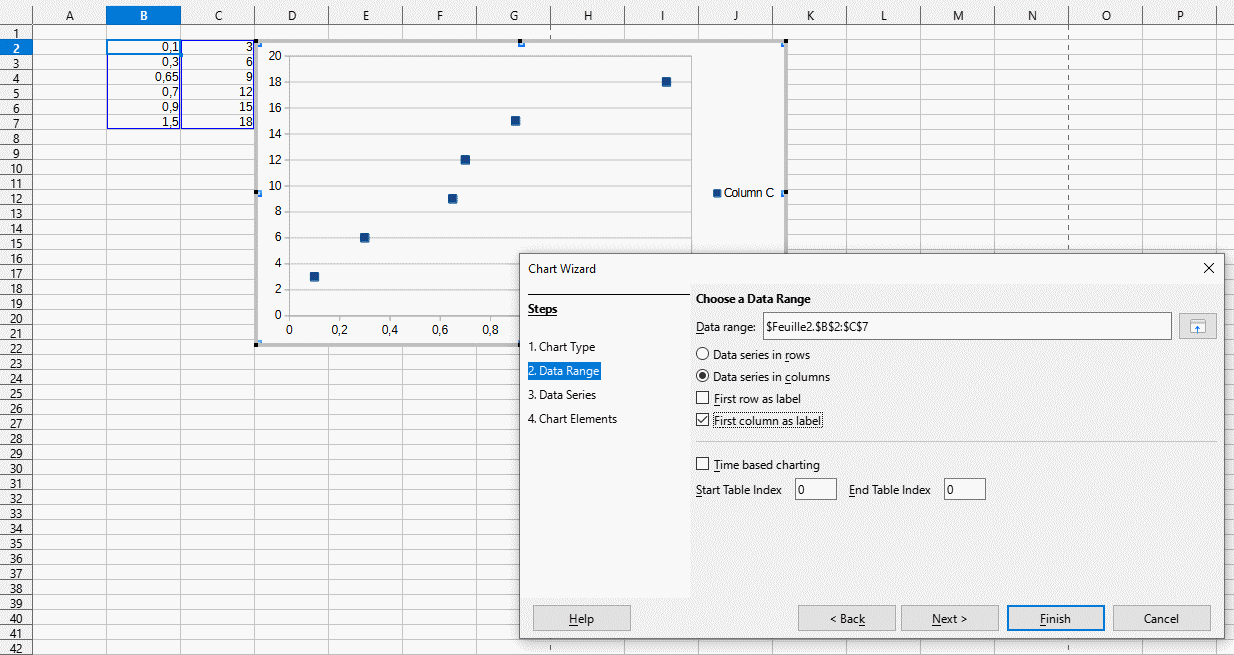
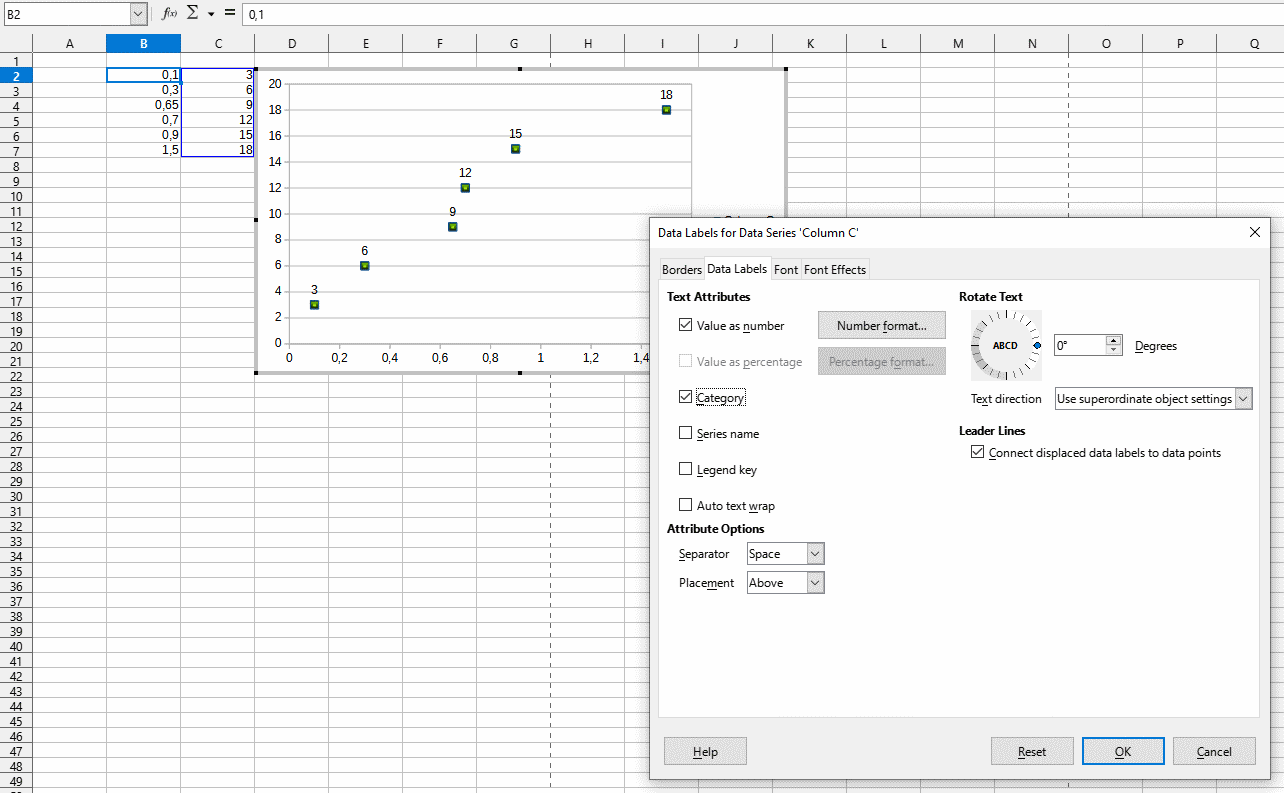
Here is the modified sample file. See the properties od the chart on the attached images:

sample file_Zizi64.ods (15.4 KB)

Put x values into the first column, and check-in the “First column as labels” option.

Switch ON the Category option for the labels feature.

1 Like

Thank you Zizi64, this worked!

Also, just a note that, even though multiple data-series share the same categories, I still managed to do this for multiple data-series in the same plot by merging the x-values for all the series in one common column and having a specific y-values column for each data-series with only specific cells for that series filled-in. I don’t know if there is a simpler way to do this though?

Can you upload an another sample file here with your “multiple series”?