Office Calc Scale Question

Having some problems with scaling on my charts. The first image shows X axis scaling for every day while the second shows only odd days. I want the smaller odd days scale. In the X axis setting I have it set to “Stagger Odd” but it’s not showing that way. Any ideas?

TIA

Could you provide (upload) a sample sheet? But probably you did not set Major Interval to 48:00:00 on your July data (removing the [x] Automatic setting in tab Scaling and assuming you are using an XY(Scatter) - type of chart).

Copied from Answer of @Codaman (which wasn’t an answer to the problem):

I can’t seem to find a difference between the July data sheet and the others. I must be missing something. Attached is the file. Maybe you can see where I errored. TIA

Temp Comparison.ods

Deleted answer.

@Codaman

I’ve deleted the answer (copied the comment into the above comment). This site is a Q&A site and not a classical discussion forum. As such “Answers” are not ordered by time but by some internal “relevance” classification and it gets almost impossible to follow any discussion after some time. Please use add a comment for all “non-Answer” communication (even within Answers).

imho … but i’m not an expert in this … the scale used is affected by:
a:) the settings,
b:) the data to display,
c:) the relation between size of data and space in graph,
‘Aug 31’ occupies a little more space than ‘Jul 31’, thus calc with identical settings may use different display,
that may also be different on OS, LO ver., used and installed fonts and so on …
to verify try enlarge the chart or change input data,

Hello,

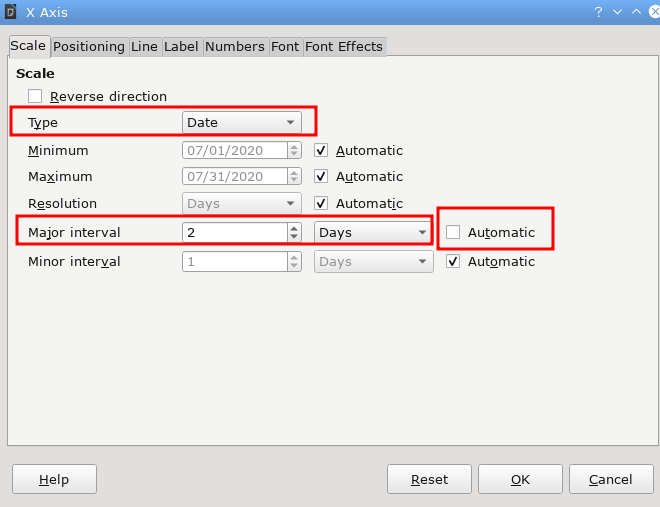
see the following modified file: Temperature-Scaling-Modified.ods where I changed (in sheet July 2020 only)

  • Format Axis (after having selected x-axis)
  • Tab: Scale
  • Set Type to Date
  • Major interval to 2

Note Personally I never use Line charts, if both axis are numerical data (and real calc dates are “numerical” data) because all other chart types treat X-axis data as categories and not numerical values. And using chart types where X-data are treated as categories may result in confusingly equidistant labeling of x-axis.

If you’d ask for the reason of the difference now, I could only provide an (tested) assumption: May, Jun, Augand Sep require little more space than Jul does and Automatic evaluates to different Major interval’s (2 for the wider months and 1 for Jul). Just use a larger font for the July x-axis and you get the same thing as on all other sheets.

Hope that helps.