Plot data with string inside

Hi I am stuck with the following issue.

This topic was not helpful:

I have exported data from seq. → as .CSV file
Now I want to plot the values over time. The issue I have is that the values are as type “string”
And as far as I understand libreoffice cant handle this?

Lets say the data contains in column B: READY, FAILED, …, etc…
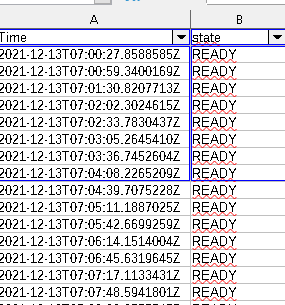
image

How can I plot it easy and fast?

x → time, y-> should plot a line between READY, FAILED, …, etc…
further I want to add another column which contains other inforation.

So my aim is to find out if the state has a connection to the other columns and plotting it would make sense for me to visualize it.

I dont want to change the data first in numbers and then plot it.

This one was not helpful either:
https://www.libreoffice-forum.de/viewtopic.php?t=19827

Thank you, kind regards

please tell us morons, which Value has READYFAILED …… etc…

btw. attach a real Calcdocument instead sceenshots.

Hi karolus
Thank you for your reply :slight_smile:

What do you mean with → which Value

please tell us genius, which Value has READYFAILED …… etc…

see the chart:
Chart_Y_Axis.ods (34.0 KB)

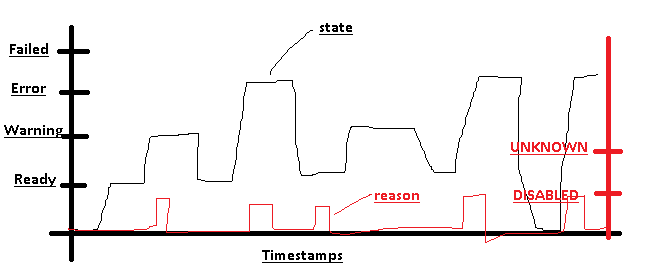
Maybe I am thinking in total wrong direction but my Idea is this:
Visualizing it → should tell me the relation between State and the Reason.
image

Kind regards

There are two requests here, I think:

  1. Plot text. I’ll attach an example sheet that does convert to numbers, if only for others seeing this who might be able to convert to numbers before plotting.
  2. Plot plateaus. In the example I used a line chart with the line type drop-box set to Stepped. Then I went into chart properties (iPhone-like switch to open properties sidebar after clicking the chart) and set Line type Properties to Step at Horizontal Mean.
    TextZulu.ods (22.3 KB)