Single days to median week values

hey there!
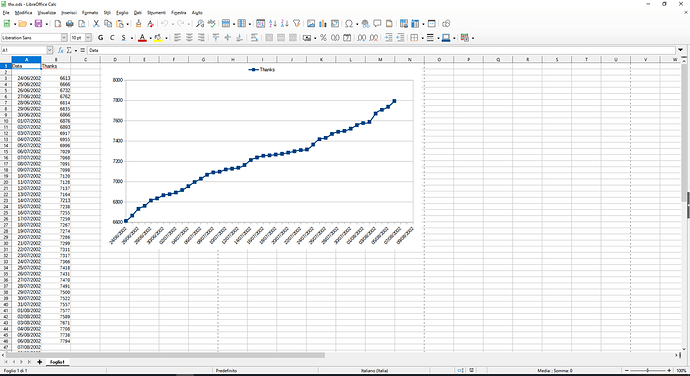
I have this simple table, on which x-axis are data and y-axis, whatever values.
what I’m trying to understand is the simplest way to convert 7 values into their average values and get a week column, so I can create a chart with a point every week and not everyday.

how do I do that?
thank you

And how do you designate the week? The start date of the week?
And if a week starts in one month and goes into another… Is it necessary to mark a new result at the beginning of a new month? In short, are we looking at a week a year or a month?
Edit: Are there any gaps in the days.
All these data must be calculated in advance.

Give an example of the week column.

I mean like to keep values of each monday, just that, but done it automatically.
So, on first, how do I add the day names?

B2: =TEXT(A2;“YYYY-MM-DD NN”)
B2: =TEXT(A2;“YYYY-MM-DD DDD”)
DDD works in Excel.

When does week start (Sun, Mon)?

Try this.
avg-by-weeks.ods (35.9 KB)


Calc manages to display only filtered data in the chart. That’s good. Dates on the chart are interpreted as text. If you remove the autofilter, the chart is distorted. So, first we enter the data, then we apply the autofilter, then we look at the chart.
NOTE: Ru Locale (the AutoFilter by day name is set to “Пн”, that is Mon). Correct the filter if necessary.

The average value formula can be freely copied from any cell and pasted into new cells.
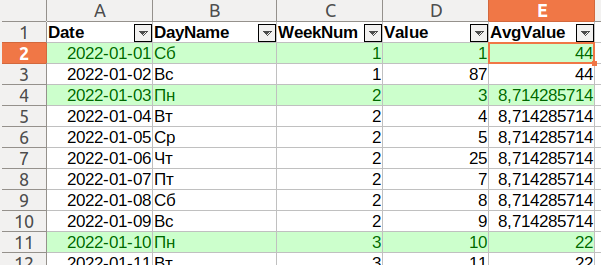
E2: =AVERAGEIF($C$2:$C$109;$C2;$D$2:$D$109)

A week starts at Monday (2).
C2: =WEEKNUM(A2;2)
WeekNum is used for conditional formatting (green lines):
A2:E109: Formula is $C2<>$C1
Снимок экрана от 2022-08-07 12-25-03

Data are aggregated on Mondays for the coming week. You have made no other clarification to my comment above.
For the chart to expand automatically, you must properly insert new rows into the data range.

What could be easier than pivot tables?
80302.ods (160.5 KB)

Yes, of course.
But…


@Villeroy, what does seven days mean? A set of any days in a sequence? And if there are skipped days. Then it’s out of the week.
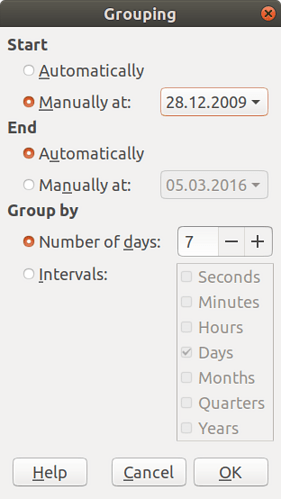
Do the seven days make up one week? It is unclear what is meant by that. The grouping operates with any days or weeks. But the week itself is not in the list of choices.

The second way, grouping the data by week number and calculating the average value looks more elegant for this task.

Intervals of 7 days, starting at Monday, 28th of Dec 2009 as shown in the first pivot:
28.12.2009 - 03.01.2010
04.01.2010 - 10.01.2010
11.01.2010 - 17.01.2010
18.01.2010 - 24.01.2010

whereas the second pivot includes the 3rd source column which is a calculated column of week numbers.
The calculated values in both pivots are the same.

Are there gaps in days (e.g. 1,2,4,7)? Are “1,2,4,7” still a week?

Delete some weekends, refresh the pivot and the date groups remain the same. This is just a regular interval of numeric values. You can do the same with any other numeric row or column field.
0-9
10-19
20-29
etc.

1 Like

Thank you. I learned something new about pivottable grouping functionality.
Now both ways look elegant. Well, my solution stands alone somewhere. :slightly_smiling_face: