[SOLVED] How to group by month AND year

I have a spreadsheet with more than one year of financial transactions and need to group them by month and category with a pivot table.

I do the usual:

  1. select my data, then create a pivot table with date for column, category for rows, and amounts for cell data
  2. In the pivot table, select one fo the date column headers and the group by month

The problem is that LO groups together the same months of different years, and I find myself with exactly 12 columns, one for all the Januaries combined, one for all the Februaries, and so on.

How can I convince LO to group by month AND year? Do I have to manually construct a MMM-YY string with the date functions in a helper column?

EDIT:
A manually constructed helper column distinguishes months from different years, but the month columns are then sorted alphabetically in the pivot table. Definitely not the desired result

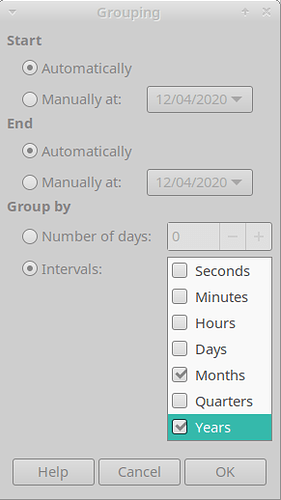
2nd EDIT: problem solved by multiple selection in the Group and Outline | Group dialog, as suggested by @robleyd in the comment below

1 Like

Have you tried selecting month and year when setting up the grouping? Using Data | Group and Outline | Group

I can’t believe I didn’t try that! To my (weak) defence, the interface seems to suggest the options are exclusive. Selecting both year and month solves the problem

Best you use a “Pivot Table” (DataPilot tool) directly. It doesn’t depend on grouped data.
You may want to study this attached example.
Please note:
-1- PivotTable does not update automatically.
-2- RightClick into any outut cell to get the approppriate context menu.
-3- Default is that PT are created in their own sheets, but you can set a different output target.

(-4- Automatic refresh is omitted for efficiency reasons mainly. There is no option insofar, but you can enforce automatic updates with the help of user code.)

Hmm, that’s exactly what I did, perhaps I didn’t explain it well enough. The question was precisely how to sort data by Month and Year in a pivot table created with the Data Pilot tool. As @robleyd suggested, selecting both options in the Group and Outline panel solves the problems

Pivot table is sorted on the order of columns in row fields, so moving the year to the beginning and then the month should work.

Create the Pivot Table (Data → Pivot Table → Insert or Edit) with the date column in the Row fields. Then

  • Click into any cell in the Pivot Table containing a date (usually the first column)
  • Go to Data → Group and Outline → Group
  • Then in the section Group by select Intervals and check the labels Months and Years

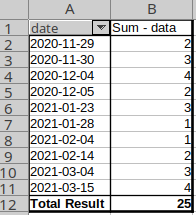
Pivot Table before Grouping:

Pivot Table before grouping

Grouping settings:

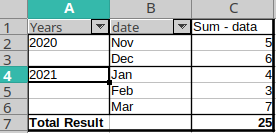
Pivot Table after Grouping:

Pivot Table after Grouping