Spreadsheet data graph percentages turn to normal numbers

Hello,
I have an issue where in Calc i have created a lot of data tables needed to create graphs, and have created graphs with the numbers as percentage, all numbers in the graphs were percentages upon last edit, and when I reopened the document all the numbers turned from percentages to normal numbers (ex. 9,7% turned into 0.097 and similar). I have to manually now correct every single graph and there are over 200 and i do not have the time to do it as the project is time sensitive. Please note all documents were saved properly and were not moved, the numbers were entered as ex. 6,7 and have been manually set to 6,7% because the percentage button and setting turned them into 6.700% and simmilar which was not fixable or changable in the tab for editing percentage formats. The file is fully created within calc and was not moved.
Thanks in advance.

Here is the version info:

Version: 7.3.7.2 / LibreOffice Community
Build ID: 30(Build:2)
CPU threads: 2; OS: Linux 6.5; UI render: default; VCL: gtk3
Locale: hr-HR (hr_HR.UTF-8); UI: hr-HR
Ubuntu package version: 1:7.3.7-0ubuntu0.22.04.5
Calc: threaded

Could you share the steps you follow?

As .ods?
I tested, without problems, saving as .ods and .xlsx with:

Versión: 6.4.7.2 (x86)
Id. de compilación: 639b8ac485750d5696d7590a72ef1b496725cfb5
Subprocs. CPU: 4; SO: Windows 6.1 Service Pack 1 Build 7601; Repres. IU: predet.; VCL: win;
Configuración regional: es-AR (es_MX); Idioma de IU: es-ES
Calc: threaded

For me, 670%

Please, edit your question (three dots button below your question, and pencil button) and share (box with arrow button) a reduced sample file to test.

Please create a copy of your file, delete most of the contents except one data set and one chart, both demonstrating the issue, and upload the reduced file.
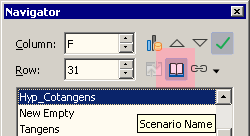
There is a powerful alternative to hundreds of charts. With scenarios you can use one chart with many exchangable data sets. Works with formulas as well: https://ask.libreoffice.org/uploads/short-url/gJR9ckCZ106LVDN6ENPlXVg4Tz6.ods

1 Like

How do you “Turn on the navigator’s scenario view”?
I answer myself:
F5 (or menu Edit - Navigator)
imagen

example.ods (313.9 KB)
Hello, here is an example file, shortened with the presented issue.

The bar charts are not linked to cell ranges. They have been copied into the sheet, and now they are based on an internal data table.

Well the process was to paste the data in the cells and make them percentages, and then create the charts by selecting said data, and it worked fine, and after saving and reopening it was well not linked if i have understood correctly, but why would that happen?

I wrote a macro to copy all the data below row 208 into one list on a second sheet.
Choose a category from the auto-filter in C1. This is similar to a scenario based solution.

scenarios_106328.ods (347.4 KB) NEW VERSION with scenarios on Sheet3.

Your numbers are inconsistent. Most values are fractions (0-1), others are percent figures (0-100).