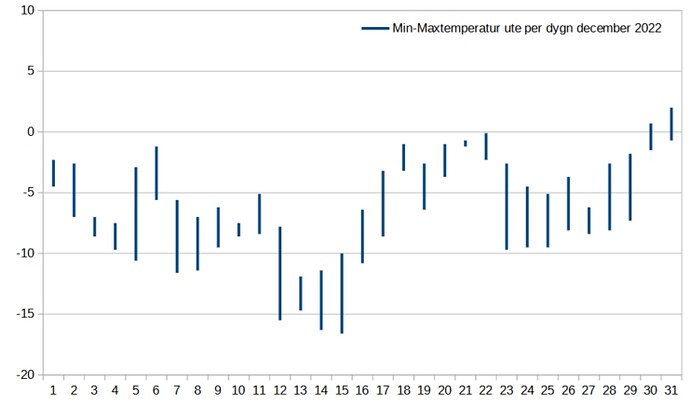
I created a calc chart to display min and max temperature per day and chose ‘stock’ as it creates vertical lines for each day. Looks good. However, after saving and later reloading, the chart looks entirely different. Looking at the data ranges, they have changed. Maybe I misunderstand something or do something wrong, so please advise me. (LO V7.2.7.2)
Chart before saving (correct):
Unfortunately I cannot upload a second img (I am new in this group).
Libre Office V7.2.7.2 / OS: Win10 Pro / File saved as .ods
I’d love to upload the file but regrettably I do not know how to do.

