SUMIFS with MONTH() criteria

I need to use SUMIFS and one criteria is MONTH(), but my returns are 0 always. Let me try explain my situation.

I have 3 columns.
Column A = DATE (in this format 01/01/2021)
Column B = Generic number
Column C = Currency
Column D = Months( like 12 row with 01/21, 02/21,…,12/21)
Im try to do this =SUMIFS(C:C,B:B,">0",A:A, “=”&MONTH(D1))

So basically I want to sum column C if column B > 0 and the month of column A is = to D1

Like this? Cheers, Al
SUMIIFS_WithMonths.ods (15.7 KB)

Yes, thank you! I didnt even think of add a column with month only(lol). I was doing it wrong, take your sheet for example, instead of using D:D in the formula, I was using A:A.

If it doesn’t slow down too much, then you were on the right track.
{=SUMIFS(C:C;B:B;">0";MONTH(A:A);"="&MONTH(E1))}
The array formula. Curly brackets are required here by the formula MONTH(A:A).
And w/o calculated ‘D’ column.

Edit:
You can also do it without brackets… but it will not work faster.
But what a clear syntax. No quotes or ampersands.
The columns are in order.
=SUMPRODUCT(MONTH(A:A)=MONTH(E1);B:B>0;C:C)
Compare:
=SUMIFS(C:C;B:B;">0";D:D;"="&MONTH(E1))

1 Like

The issue with SUMPRODUCT() and whole columns A:A, it is that it is slow, because it not shortcuts at the last row with data, it analyzes the whole column.

Can anyone explain to me where the tradition of writing "="& in the SUMIFІ() condition comes from? Okay, when comparing “greater than” or “less than”, it helps. But when comparing for strict equality - why?

Maybe some people use it in answers to show users how them can use comparisons.

“I could think of a much more complicated way,” said the White Queen proudly.

Somebody may want to make the comparison for “equal” (the default) explicit.
(And, of course we might find an even much more complicated way if we try hard enough.)

Only SUMPRODUCT()? …but not SUMIF[S] ?

1 Like

The difference is array vs range evaluation. SUMPRODUCT() forces all arguments to array evaluation, so an expression like =SUMPRODUCT(MONTH(A:A)=MONTH(E1)) produces an array/matrix of 1048576 TRUE and FALSE elements. It’s better to use the actual ranges, like =SUMPRODUCT(MONTH(A1:A999)=MONTH(E1))

Yes, of course. You can even take a range with an excess, but not an entire column. I just didn’t complicate the recording, but left the method proposed above.

I was thinking that maybe a pivot table would be better. I need a couple of helper columns but probably someone can do it better. The important thing is that if you have months in different years you need to be able to separate them out.
In the new spreadsheet there is still my original SUMIFS with all its shortcomings. You can see the total does not match that in the pivot table because I have changed a couple of dates to 2019 now. The SUMIFS doesn’t differentiate between years in my formula, of course you could correct that.
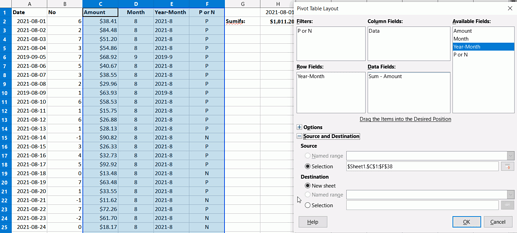
So add a helper column and head it Year-Month, in cell below enter =YEAR(A2)&"-"&MONTH(A2) and drag down to fill cells below, and another to select numbers in column B greater than 0, Head it P or N and enter in cell below =IF(B2>0;"P";"N") and drag down.
Select the last 4 columns (we only need three but I think they need to be contiguous), click Data > Pivot table > Insert or edit. A small dialogue box will appear asking Current selection, OK it.
The main pivot table dialogue opens. Drag Amount to Data, **Year-Month to Row fields, and P or N to Filters. Ignore Month. Click OK

And final ods with pivot table, Filter to show only P (numbers greater then 0) and get a total for each month in the sheet.
SUMIIFS_WithMonthsPivot.ods (18.6 KB)

You can do it better, too. Create a pivot table for the source data: Row Fields - Date, Data Fields - Sum-Amount, Filters - No. Now select any date in the pivot table and choose Data - Group and Outline - Group or just press F12. In the form, check the boxes for Months and Years. Now in Filter, turn off negative and zero values for No. Enjoy result

1 Like

@EarnestAl: that is not necessary. The year is taken into account.
=SUMPRODUCT(YEAR($A$2:$A$38)=YEAR(E1);MONTH($A$2:$A$38)=MONTH(E1);$B$2:$B$38>0;$C$2:$C$38)
@erAck: it works very fast now. The ranges are reduced.

The OP must know how to ensure that the range of the table is expanded.

1 Like

For my sample sheet of random numbers, in column B, there are only two negative values plus 0. I don’t know how many negative values there are in OP’s data, it could be tedious unticking many.

It is a while since I did any pivot tables but I did do them regularly once. As soon as I saw your mention of Group and Outline, I knew I needed to brush the dust off those old skills; I now remember doing that before. Cheers, Al

@EarnestAl I don’t think this will be a big problem for the OP - most likely, he has no negative numbers in the data at all. Do not forget that you are the complete master of your data - no one bothers you to pre-filter the original table (No >0) with copying the filtering result to another range and build a pivot table based on this data.

Thanks everyone for all these options that I have now. Didn’t know that this community was so awesome.

2 Likes