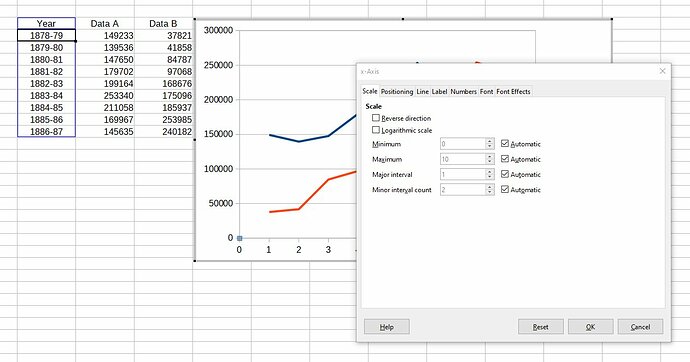
I have three columns of data which I am plotting an x/y chart. I wish to have the x-axis labels taken from the first column. This does not happen automatically, the x-axis is labelled 0 - 10 even though the correct range for the x-axis labels is shown when the chart is being created.
Previous questions and the LibreOffice Help implies that this can be corrected by editing the chart, right clicking on the x-axis, choosing “Format Axis” and in the “Scale” tab choose “Text” from a combo box. But in the scale tab I don’t see such a combo box.
I would be grateful if somebody would explain what I am doing wrong. I attach the example sheet: Untitled 1.ods


 ) next to the answer.