Calc: how to sum rows with a specific index at their specific column?

test.ods (10.8 KB)

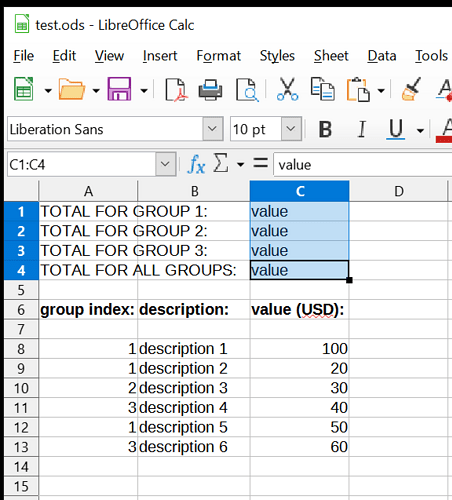
There are rows after row 7 with an index at column A, which specifies what group the item of that row described in column B and with a value in column C belongs to.

The groups with their SUMs are in rows 1-3, and row 4 is for the SUMs of all 3 groups.

I’m not sure how to set this up.

When there are no groups for the items and you just need to check the total sum, you can just select all the cells with the values and do “Select Function → Sum” or do SUM(C8:C13), but the grouping requires the formula to check the index value in a specific cell of each row individually.

I’m also not sure how to specify the sum with a beginning column but no specific end. I tried SUM(C8:) which is how some programming languages would allow this, but that doesn’t work.

A pivot table will be your friend.

1 Like

This task could also be solved with a simple SUMIF() function:

=SUMIF(A$8:A$13,1,C$8:C$13)

test.ods (14,9 KB)

Any ideas how to not limit to the current max row available? I guess a huge number like 10000 could be used to allow adding rows to the document without practically reaching the limit. How would you also check an extra/sub group? Sounds like SUMIFS can be used but it is confusing

Extra groups, sub-groups, grouped dates with pivot tables: https://ask.libreoffice.org/uploads/short-url/m4CfCqn8ejQTSnyjsRjrJ48LYir.ods
If a pivot table is not good enough or when dealing with millions of rows, a database component is part of your office suite.

Introduction

https://books.libreoffice.org/en/CG74/CG7409-PivotTables.html

Many requests for spreadsheet support are the result of using complicated formulas and solutions to solve simple day-to-day problems. For more efficient and effective solutions, use the pivot table, a tool for combining, comparing, analyzing, and summarizing large amounts of data easily. Using pivot tables, you can view different summaries of the source data, display the details of areas of interest, and create reports, whether you are a beginner, an intermediate, or an advanced user. Besides, you can create a pivot chart to view a graphical representation of the data in a pivot table.

I got a bit confused going through the documentation about pivot tables. I managed to learn how to use SUMIFS. Is that an acceptable approach?

Once created, pivot tables are easier to manage (like database queries). You don’t have to maintain any formulas. New (sub-)categories (by mistake or on purpose) appear automatically in the pivot table without writing formulas for the new category. If a new category occurs by mistake, you have to compare the sums of your sumifs, otherwise you don’t take notice of the mistake.
95% of today’s spreadsheet users try desparately to use the calculator software as a database surrogate although the main functionality has nothing to do with databases. The pivot table is the number one feature which comes closest to database queries. It is the only user-friendly spreadsheet feature which is able to derive tables from other tables.