Calc: Running total based on Weeks

I’m developing a spreadsheet that holds a list of customers that are given a weekly order at a local market.
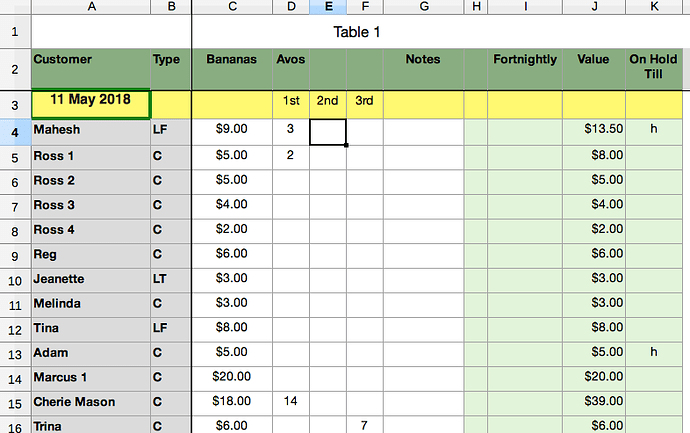
Sheet A is the customer list with their order in columns C - F, which is then totalled in column J. Column K is a flag for orders placed on hold while a customer is unable to collect an order while away.

The order quantities rarely change so I’m wanting to total the same numbers in the same columns each week.

Sheet B shows the same customers with the accumulating total in column B, and, even though it’s not shown in the example, column C will freeze the total of any order that is flagged in sheet A, column K, with a '“h”.
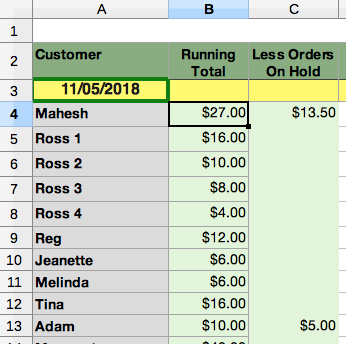
image description

So, I think I need to look at the date to see when a week rolls over, so the order can be recalculated to update the running total, but haven’t worked that out yet.
I need to find a way of counting the seven days and calculating the (accumulating) running total.
I’m not very experienced at spreadsheets, so would appreciate someone out there showing me the light.

If anyone has the time, I would also like to know how to set monthly, quarterly and yearly totals.

Many thanks in advance.

Quoting @Sights: “Sheet A is the customer list with their order in columns C - F, …”
That’s not what I see - and it’s even nothing I would assume possible.
If not a customer is restricted to order once and never again, you need to list the orders using either a “foreign key” into a customer list or the customer name itself in this role.
Concerning the weekly totals you will run into vast complications as long as not the date is made part of each order (row of the respective sheet).

Please don’t append images, but real examples (.ods file in case of Calc questions).

Contributors from the world of real business would advise you to not use Calc for the purpose behind your question, but to create a database for it.

The example is not clear. How does $9.00 and 3 total $13.50? Or $6.00 and 7 total $6.00?
Please edit the question to give a simplified example that demonstrates what you are asking. See guidelines for asking.

Sorry Lupp, I did say I was a novice! : (

This is the first time I have posted an example of my sheets. I didn’t know I could post “real examples”.

Maybe I should use a database, I am much more proficient at programming in that area.

Hey Jim K, the figures in columns C,D & F, represent numbers of Avocardos. There is a formula multiplying the unit price for 1st and 2nd grade fruit, while the 3rd grades in column F are free - hence $6 and 7 total $6.

Sorry for the confusion, and maybe I will look at starting again with a database. : )

Wrongly assuming you might even be less familiar with databases (which I had to “respect” for some time, but didn’t like myself), I made an example for the running subtotal regarding the hints I gave in my comment above.

The result does neither emphasize “prettysheeting” nor strict closeness to the structure shown in the images attached to the question. My concern was to exemplfy an idea how to do such things with spreadsheets without disregarding the most basic principles of databasing.

As I very rarely designed a (even extremely simple) database myself, I may not be the best advisor in this case. Since the mentioned example once was made, however, I now attach it here with due modesty.

Thanks very much for your effort Lupp, I do appreciate the time you put into this example.
I will have a better look at it tonight, and also the possibility of creating a database. Used to to them 25 or more years ago, when I worked in IT, but probably a little rusty by now - should be fun.