Copy / paste calc multiple sheets question

HI Folks

I have a calc spreadsheet with multiple pages.
There’s a summary page, and each of the sub-pages have a list of items that I’ve restocked on my 2-weekly visit to one of my retailers.
The sub-pages are filled out one by one (after each restock visit) - and then I need to import the data onto the summary page.

So far, the only way I’ve found to add the latest of the sub-pages is to go to the summary page, copy/paste the last column of data into a new column, then search/replace that data to correct the reference so that they point to the latest ‘restock’ page. I then have to correct the cell references as calc (helpfully) tweaks them during the paste so they refer to the next column along (so cell 1a in the copied column becomes cell 1b once it’s been pasted.

Is there a smarter way to do this?

Thanks
Adrian

Yes, there is a way. You need to collect all the data on one sheet, adding a field to identify data from different subpages (sheets). And link the data to the pivot table once.

Thanks for the reply…
Can you link me to somewhere that explains this - I’m afraid I don’t really understand what you’re suggesting…

In an ideal world, I would put all the data straight onto one sheet, but calculations take place on each of the sub-sheets, so just having all of the data to be entered on the one ‘summary’ sheet doesn’t really work.

Is there a way of copying/pasting a column of data on the summary sheet, without calc ‘helpfully’ messing with the cell references (changing a1 in the source column to b1 in the pasted column) ?

This is a 100% database task. Every professional would use a database for anything like this. If you use a spreadsheet for a spreadsheet, you have to be fairly proficient with spreadsheet programs in order to avoid messy data and wrong results. No, we can not suggest any example “solution” on sheets because we don’t know anything about your data. Please upload your current spreadsheet with a few rows of dummy data showing all the dates, numbers and some dummy names that need to be stored.

Thanks for the reply.
I was (at one time) reasonably ‘professional’ at coding real-time process control software, and then at website design - but very much ‘self-taught’ on spreadsheets.

I’ll see if I can dummy-up a simple (redacted) version of the sheet so you can see what I’m trying to do.

Doing it my ‘unprofessional’ way works - but it’s a bit ‘manual’ - and there are only ever 10 to 15 sub-sheets in a year - so manual copying and then correcting the cell references is do-able - but always looking to see if I’ve missed a trick somewhere…

Watch this space for a dummy spreadsheet.
Thanks
Adrian

It is always a mistake to store equally structured data in separate cell ranges. It simply makes no sense. All the cell functions and database-like aggregation tools assume one flat, simple list.
EDIT: of course, I know many tricks to analyse data across sheets, but this involves very complex array formulas or even macro coding. It is completely impossible without actual data at hand.

OK - here’s a dummy version of what I’m doing.
Each of the sub-sheets represents the sales figures from a separate ‘restock’ visit to my retailer, sub-sheets named by date.

To add a new set of ‘restock’ info I do this

  1. Copy the latest sub-sheet to a new sub-sheet
  2. Re-name it with the date of the restock
  3. Complete the info on the new sub-sheet (date and items sold)
  4. Go back to the ‘summary’ sheet
  5. Select the rightmost column - copy/past it to the next empty column
  6. Correct the references in the pasted column so they point to the most recent subsheet
  7. Correct the references in the pasted column so they point to the right cells

*6 and 7 are done by find : replace

This is probably (certainly) not the of elegant way of doing this, but it works for my purposes.
If there’s way to avoid doing steps 6 and 7 then that would be great - failing that, I’ll live with my ‘un-professional’ way of doing this.

As I say, it’s an annual task, and only involves some 10 - 15 columns of data - so doing it the way I describe above isn’t the end of the world.

Thanks
Adrian
11- sor master-sheet - dummy.ods (24.8 KB)

Nothing prevents you from combining all the data on one sheet. Filter data by date (AutoFilter). Totals or subtotals on top of data.
The Summary sheet must be a pivot table with the dates in the column area.

Thanks - appreciate the pointers.
I need to do some reading-up on this.

Thanks again
Adrian

Flat list with a derived pivot table and pivot chart:
Pivot_Mont_Person_Category.ods (88.3 KB)
One header row, one column of complete dates, values below values, text below text, no empty rows, no empty columns. Rows in random sort order. Very simplistic and similar to a database table.
The pivot table on same sheet is derived from the flat list. First I created a pivot with dates and categories as row fields, persons as column field. Then I grouped the dates by months and years.
Add data to the list in newly inserted rows, right-click>refresh the pivot.

SimpleInventory_embedded.odb (55.5 KB) is a most simplistic database with one input form for ingoing items and one for outgoing items (no prices). Dates are added automatically. A third form shows in and out for each selected item. Reports generate printable output.

Thank you - I will take a look.
Adrian

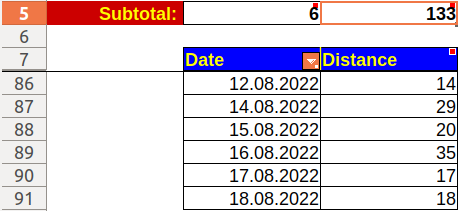
Look at this.
Снимок экрана от 2022-08-28 19-19-36

B7: =AGGREGATE(3;5;$B$8:$B$91) '=6
C7: =AGGREGATE(9;5;$C$8:$C$91) '=133

Create your own data fields instead of column “Distance”.

Thanks…
I appreciate the help.
Adrian