Drawing circles for printing

I want to generate circles to specifications: diameter width, marked center, diameter lines, radii etc.

The Draw help page has one example, but I’m looking for a more comprehensive API. I prefer Python but the namings are usually consistent between languages and so can usually translate to Python from Basic or whatever language.

If there is not a Draw API, perhaps there is a broader library of examples?

You should start with Basic because there exist more documentations.
Starting point could be:

Why do you cannot do the task directly in LibreOffice but need macros?

It is not really clear to me, what you want to achieve. In case you need additional lines and points in a shape, creating own ‘custom shapes’ might be another solution.

This wiki page is collected links to these and other related information sources.

Good question. I want to be able to specify precisely markers for center, markers for arbitrary radii, markers for diameter etc.

I don’t see a way of doing that through the GUI.

Am I missing something?

CustomRadius.odg (13.4 KB)
To get a clearer picture of your needs, I have attached a document with an own made custom shape. When you click on it, you see 8 square handles for changing the size of the shape and a round handle to change the radius. All these can be changed numerically in the Position&Size dialog.

The first page of the dialog sets the position and size of the shape as indicated with the 8 square handles. You can select the center as anchor so that you can exactly set the center of the circle.

The third page of the dialog allows to set the position of the round handle. The values are measures from the left and top edge of the rectangle given by the 8 square handles.

You can do a lot by defining your own custom shapes, without using any macro. Unfortunately there is no UI for defining own custom shapes, but you need to write markup in the file.

Does such kind of shapes would solve your requirements?

1 Like

Depends - and of course nobody here knows everything.

  1. Draw is not a 2D-CAD software or a surrogate for all the existing programs for “Dynamic Geometry” (GeoGebra, C.a.R, Cinderella, Cabri, Geometer’s Scratchpad, … or - what I preferred but now is a nearly forgotten freeware- DynaGeo by Roland Mechling)
  2. I’m still wondering what exactly you mean by the term “marker”. Do you know the SnapGuides provided by Draw? (I don’t use them much myself and may miss some of their capabilities and their shortcomings as well.)
  3. Specifically about circles: I don’t know a way to snap the center to any object. If I needed this urgently, I would create calculated snappoints for a diagonal of the framing square of the circle.
  4. My preferred approach concerning polygons was to create them as drawing objects in a Calc sheet where I calculated the vertices. The resulting shape then could be pasted and located everywhere in Draw, Writer, Calc, … If you are interested, I may find an old example of the kind. Of course you can create different graphic shapes (circles e.g.) this way, too.

By ‘marker’ I mean, for example, a line through the diameter at a given angle, a radius, tangent, any chord…

I really like your idea of a framing square. I’ll give that a try.

And please: I’d like to see an example of generating a drawing object in Calc and so on.

Yes. This is a very good idea. I will look into it.

You do not need to “generate” a drawing object in Calc. You can generate the object in Draw. When it is finished, drag it into the Gallery so that it is generally available in other documents or copy and paste it to Calc.

How to generate an object in Draw given some specification. For example, I want a circle with a center at say, 100,100 and a radius of 5 cm.

I want also a line through the diameter at some specified angle, chord(s) at some specified distance and so on.

Draw any circle, open the dialog Position and Size..., set Width = 10 cm and Height = 10 cm. Concerning the center your question doesn’ actually tell anything (no unit, no origin). Assuming the origin is (0; 0) (unit not needed with 0), and your (100; 100) means (10 cm; 10 cm), then set Position X = 5.00 cm and Y = 5,00 cm. You won’t need Calc for this kind of arithmetic.
However (@Regina) I don’t know how to get the circumcircle of a triangle (defined by coordinates for the vertices) without a lot more of calculation. I know how to do that in Calc. I also could calculate the needed points in the needed order for the star formed from specific diagonals of a regular heptakaidekagon. in Calc. That was the background for my suggestion to use Calc. In fact I could do it with much less effort in DynaGeo if I only needed such a shape printed. Geometry software is made for such tasks. (Every implementation suffers from different shortcomings and all of them from some common ones.) I did it nonetheless with Calc/Shapes in LibreOffice because I had in mind arrangements with a lot more (of images, additional shapes, special coloring). Similar may be the reasons for what we create charts in spreadsheets, and don’t use vector graphic for the task. We may add some, finally, however.

To exemplify more clearly for what I sometimes created drawings in sheets (and with the help of spreadsheet functionality even more than demonstrated in the example) I attach a little demo:
calculatedShapes_indirectExperimental.ods (40.7 KB)

Very Nice. Thank you.

My first post to this thread mentioned “2D-CAD” as one alternative (not used by myself), and some well introduced programs for interactive and dynamic geometry where you can create very complex drawings, and won’t need to repeat any steps if you want to change some base elements. Simply change them ( by dragging points, readjusting a ruler, redefiining a numeric entry), and the complete drawing containing probably hundreds of geometric objects will follow in no time. The software I listed (at least three of them I actually know to some detail) are really good. The only two problems (though serious) are: missing interoperability and missing true sub-programming. They all can create “macros” or “tools” which often are nice, but can’t be edited later to update their functionality, enhance efficiency, fight old little bugs.
Since I am retired I don’t use that software much, but in the depth of my drives there are some of the complex drawings I talked of. You can get one , and the software I used is free nowadays, anyway (but only developed for Win :partying_face:). Amazing what individual developers have come up with.The file of an extremely complex consruction is then <100KiB (of XML) and the software is around 1 or 2 MiB. No bloated stuff.
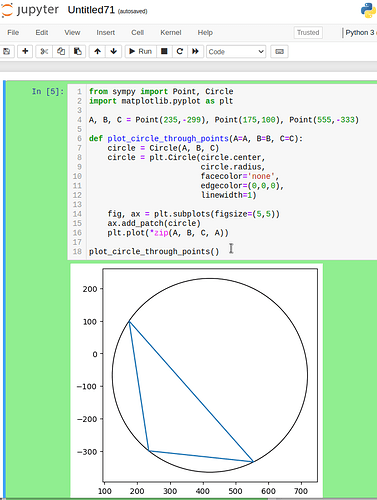
with bloated stuff!

Well that’s something.

I tried running the code through the standard interpreter and do not get an image. I suppose I need Jupyter.

I’ve installed Jupyter now and will have to figure it out.

Thanks