Help with pivot table: monthly sum of daily measurements, averaged over multiple years

I have several years worth of daily weather data. Some of the data is an average measurement from a given day (like the Max Avg Air Temp shown below) and some is the total measured during the day (like the Total Precipitation)
Screenshot from 2025-07-08 17-17-26

My ultimate goals are to:

  • For each day of the year, know the AVERAGE value of both measurements over all years of available data
  • For each month of the year, know: the AVERAGE of Daily Max Air Temps, but the monthly SUM of the daily precipitation totals, AVERAGED over all years of data

Some screenshots:

When I create a pivot table of the data, with the Date as rows and both measurements as columns and set the functions of each to AVERAGE, and group the date by “Daily”, things look correct:

Screenshot from 2025-07-08 17-17-44

However, when I change the grouping to “Monthly”, the Air Temp values are correct but the precipitation values show an average of the daily values for a given month over all years. I’d like for this value to show the sum of the daily precipitation values for each month, averaged over all years of data.
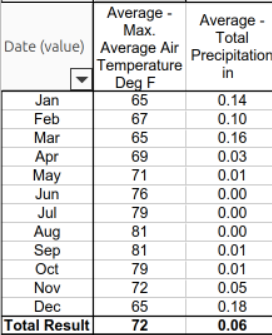
Screenshot from 2025-07-08 17-18-10

When I change the function of the Precipitation column to “Sum” instead of average, it shows the sum of the daily values of each month, but summed over all years of available data:

Screenshot from 2025-07-08 17-18-59

Attached is a file with the data. Thank you in advance!

file for forum question: monthly sum of daily measurements averaged over years.ods (66.6 KB)

Keep average, and add a column to multiply the result by 31, 28.25, 31, 30, etc.

Ah, that is certainly a simple and effective solution! Thank you.

Perhaps there is no way to obtain this result using solely a pivot table?

Also you can add a column “Total Precipitation Average By Year” (see attached file).
file for forum question_ monthly sum of daily measurements averaged over years.ods (65.4 KB)

2 Likes

Thank you @sokol92 - this seems to work, though the resulting totals are slightly different than those calculated using the strategy @LeroyG suggested.

Can you help me to understand what exactly your formula in column D is doing? My brain cells are not firing at full capacity today…

Unfortunately, this applies to me not only today. :slight_smile:
Your observation period: from 2019-03-01 to 2025-06-29. There is a different number of rows for different days of the year (6 or 7).
In column D I have (as intended) a fraction, the numerator of which is the amount of precipitation for the current date (column С), and the denominator is how many times this day of the year is repeated in the observation range.
I hope that after summing up the column D value in the pivot table we will get the average precipitation value by year for this day of the year.