How can I see only the latest year for each country in a spreadsheet?

Hi. Please see the long Wikipedia country table in the article titled:

The main reference is a spreadsheet named:

The latest year available varies by country in that spreadsheet.

To update the Wikipedia table I only need the latest year for each country in that spreadsheet. How do I use Calc to quickly remove all other years in the spreadsheet?

Someone told me how to do it with Excel, but I don’t use Excel. See the latest thread on the Wikipedia article talk page for links to that discussion, and a sandbox with more info.

I intend to put this Calc how-to info in Wikipedia’s Help:Table page since there are many similar tables needing quicker updates. I already added some Calc how-to info to that help page.

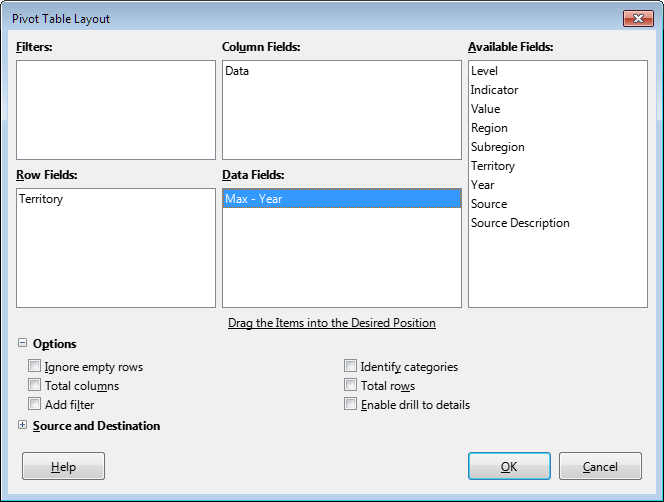
Try this sequence of actions. First, create a simple pivot table

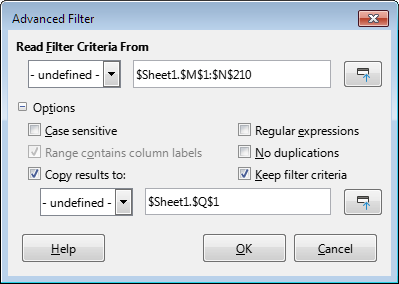
Copy it to the data sheet (for example, starting from cell M1). Rename the heading “Max - Year” to “Year” (the name of the data should be the same as in the original table). Now apply the Advanced Filter to the original table, specifying the table with the names of territories and maximum years as the Filter Criterion.

AdvancedFilterMaxYear

You should get something like this.
homicide_total_rate_and_count.ods (222.7 KB)

Don’t be surprised if the filtered table is long - there are rows with duplicate data in the original table (e.g. Angola 2012)

Thanks! Learning a new language is difficult! I finally figured out what you did. I duplicated what you did. I then started over and deleted the long source names first, and repeated the procedure.

I copied the resulting table to a new sheet. I ordered the columns to be in the same order as the Wikipedia table.

I am stuck though at how to transpose the “homicide rate” and “homicide count” from rows to columns. As it is in the Wikipedia table. I attached what I have so far.
Advanced filter result - Columns ordered.ods (24.7 KB)

I added two helper columns H and I which titled “Homicide count” and “Homicide rate”.
H2 =IF(D2=$H$1;E2;"") and I2 =IF(AND(A2=A3;D3=$I$1);E3;"") and fill this formulas down.

After that, I got rid of the formulas (I just copied and used Paste Special), sorted by column H, deleted the bottom rows, which have no values in this column. After that, I changed the order of the columns and sorted by column A.

Advanced filter result - Columns ordered - Short.ods (25.4 KB)

I copied the formulas to the new columns. Then I copied the sheet, and tried pasting it into a new sheet. But I don’t know how to get the formulas to work. Here is what I have.
Advanced filter result - Columns ordered - Formulas.ods (25.7 KB)

You missed the “=” sign - so that the Calc understands that this is not just a text IF(D2=$H$1;E2;""), but a formula, the expression must start with a “=” sign.

Open your spreadsheet, go to cell H2. Press F2 - the cell will go into edit mode. The cursor is at the end of the line. Press the Home button - the cursor will move to the beginning of the line. Press the = button. Now press Enter. Do you see? Instead of the text of the formula, you got the value 2474. Repeat these steps for I2. Now multiply the formulas from H2:I2 for the entire range.

Thanks again. I pasted in the formula starting with the equal sign. Then I dragged it down the column. Worked great. Thanks. Then I copied the sheet to a new sheet. Hopefully without the formulas.

I deleted some columns, and ordered them to match the Wikipedia page. But I can not add a thousands separator to the homicide count column. I also can’t reduce the rates to one decimal place. Normally I have no problem doing this. Here is as far as I have gotten:
Homicide count and rate columns - No formulas - Sorted.ods (24.1 KB)

You actually have the apostrophe (’) before your Homicide Count numbers, so Calc thinks they are text, not numbers. To keep on from here rather than going back to earlier steps, create a new column (like Homicide Number) and have each data cell be =VALUE(E:E). Then copy that column, mark the E column, and Paste Special - Number back over the old column. Now you can Format Cell - Number - -1,235 or whatever you want for that column of numbers (header excepted, of course). The rates problem is the same problem, with the same solution, but obviously =VALUE(D:D) for your temporary column.

I went back to the sheet with the “Value” column. It had both count and rate. It had the apostrophe (’) before each number.

I copied only the data cells from that column (not the header), and then pasted into a selected column of blank data cells (header not selected):
Edit menu > Paste Special > Paste Unformatted Text. This got rid of the apostrophe (’).
I deleted the old Value column, and kept the new one.

I then used the formulas to create the Homicide rate and Homicide count columns. Then I copied that sheet to a new sheet to get rid of the formulas:
Edit menu > Copy. Then Edit menu > Paste Special > Paste Special > Values only.

I deleted the Indicator and Value columns. I ordered the remaining columns in the same order as the Wikipedia table.

I rounded off the “Homicide rate” column to 1 decimal place numbers: I selected the “Homicide rate” column via header:
Then: Format menu > Cells > Number > 1 decimal place

I added a thousands separator to the “Homicide count” column: I selected the “Homicide count” column via header:
Then: Format menu > Number Format > Thousands Separator.
Homicide Count and Rate columns. Wikipedia. 1 decimal place.ods (22.2 KB)