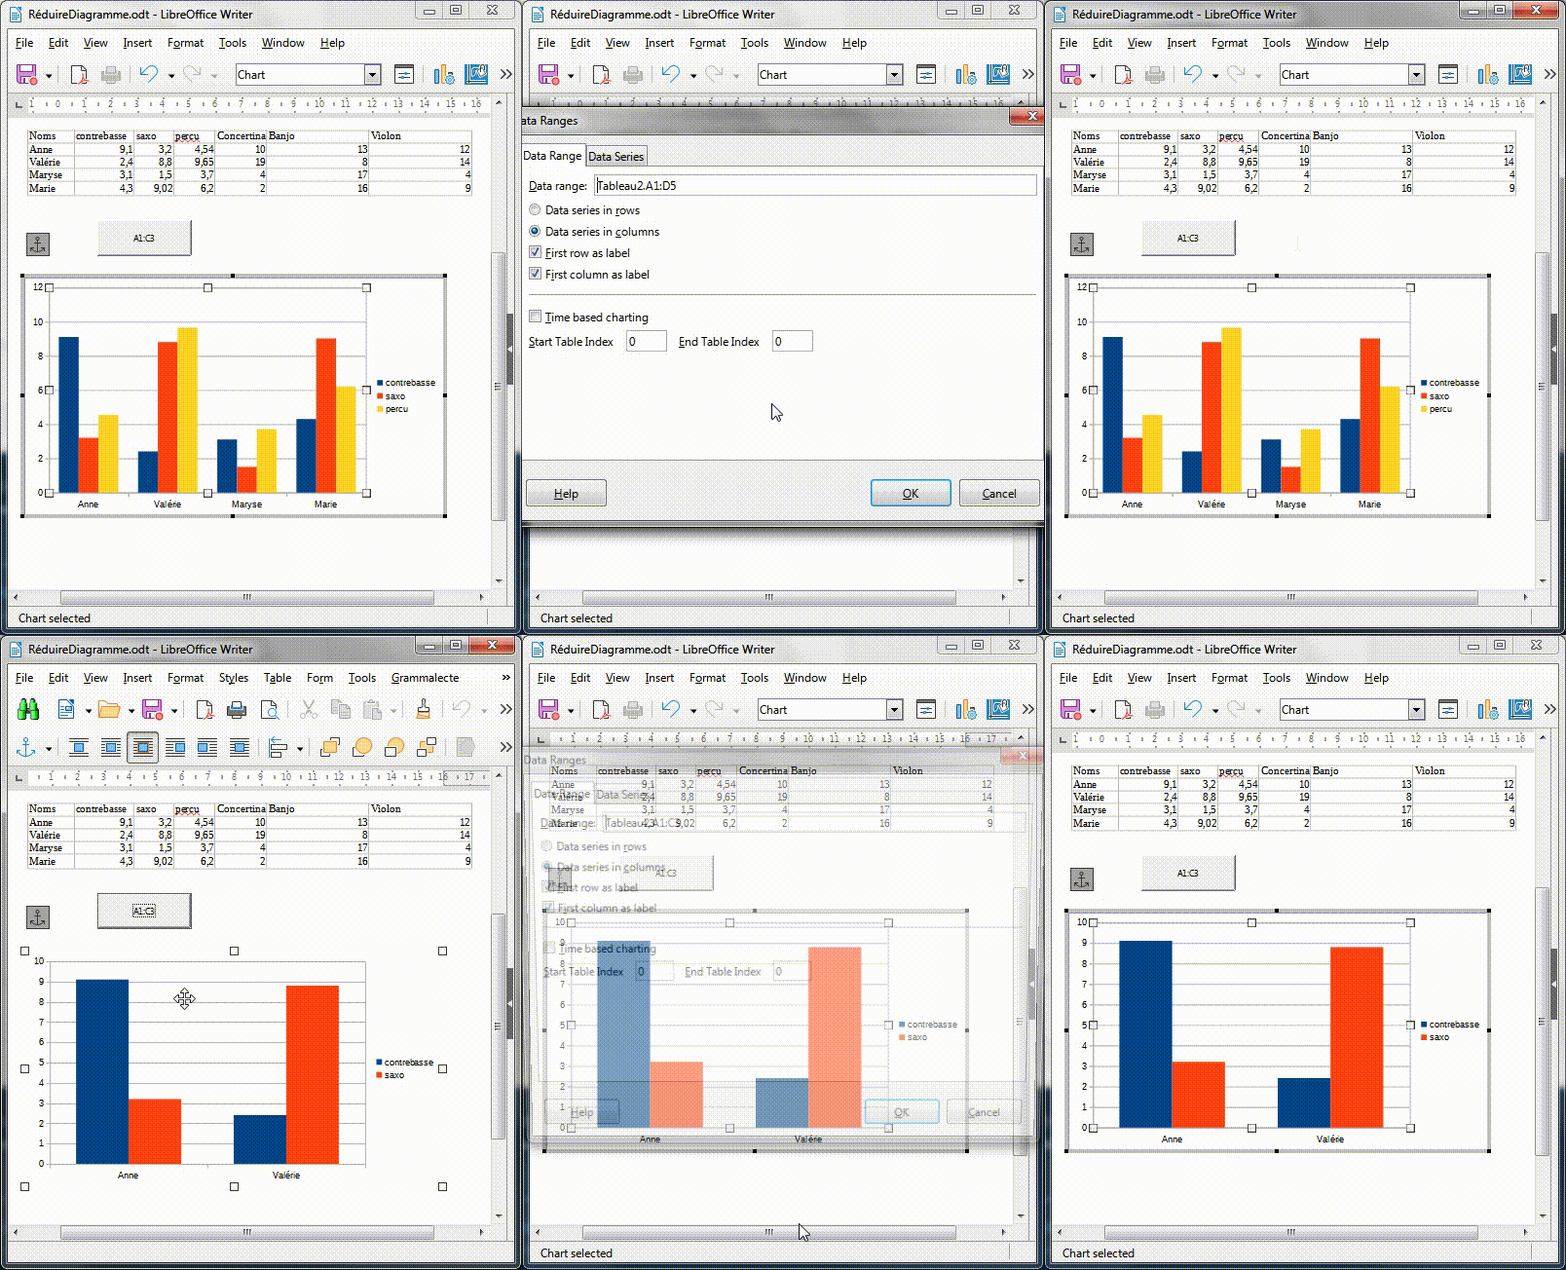
Found the solution for column A ! … I used my version of MiseAJourColonne to update DataSequence(0)
Complete code … this way the code preserve the diagram configuration … just change the data range.
Column A needs to be treated separatly, not considered as data !
Sub A1D3
	ModifSourceDiagramme(array("B", "C", "D"), 3)
End Sub


Sub ModifSourceDiagramme(colonnes,  derniereLigne as integer)
	'COLORS FOR THE CHART
	dim aColors() : aColors=array(RGB(0,69,134), RGB(255,66,14), RGB(255,211,32), RGB(87,157,28), RGB(126,0,33), RGB(131,202,255))
	dim o,  oExt,  document,  oDiag,  oDataProvider,  oDataSequences, oDiagram, oCooSys, oCoods, oChartTypes, oChartType, oDataSeriesList, oDataSeries
	dim dimDataSequences as integer,  numColonne as integer,  col as string,  nseq as integer

	dim uColonnes as integer : uColonnes=ubound(colonnes)

	' récupère le diagramme (unique dans le document)
	document=ThisComponent.CurrentController.Frame
	o=document.controller.model.embeddedObjects.getByIndex(0)
	oExt=o.ExtendedControlOverEmbeddedObject
	oDiag=oExt.component

	oDataProvider=oDiag.getDataProvider()
	oDataSequences=oDiag.DataSequences
	oDiagram=oDiag.getFirstDiagram()
	oCooSys=oDiagram.getCoordinateSystems()
	oCoods=oCooSys(0) ' this chart has only a coordinate system
	oChartTypes=oCoods.getChartTypes() ' chart type one by one
	oChartType=oChartTypes(0)


	MiseAJourColonneA( oDataProvider, oDataSequences, 0, _
		"Donnees." & "A1:" & "A1", _
		"Donnees." & "A2:" & col & cstr(derniereLigne) )


	' DataSeries actuel
	oDataSeries = oChartType.getDataSeries()
	redim preserve oDataSeries(uColonnes)

	for numColonne=0 to uColonnes
		col=colonnes(numColonne)

		MiseAJourColonne( oDataProvider, oDataSeries, numColonne, _
			"Donnees." & col & "1:" & col & "1", _
			"Donnees." & col & "2:" & col & cstr(derniereLigne) )

	next numColonne

	' mettre à jour DataSeries
	oChartType.setDataSeries(oDataSeries)

	' mettre à jour le diagramme
	MiseAJourDiagrammes()
End Sub


Sub MiseAJourColonne(oDataProvider as object, oDataSeries, numColonne as integer, sLabel as string,  sValeurs as string) as object
	dim oValues as object,  oData as object,  oLabel as object, oSeq as object

	oData=CreateUnoService("com.sun.star.chart2.data.LabeledDataSequence")

	oSeq=CreateDataSequence(oDataProvider, sValeurs, "values-y")
	oData.setValues(oSeq)

	oLabel=CreateDataSequence(oDataProvider, sLabel, "")
	oData.setLabel(oLabel) ' label is used as name

	oDataSeries(numColonne).setData(array(oData))

End sub


Sub **MiseAJourColonneA**(oDataProvider as object, oDataSequences as object, nseq as integer, sLabel as string, sValeurs as string)

dim oSeq as object, oValues as object
dim newrepr as string
dim newvalues as object
dim newseqValues as object
dim newseqLabel as object
dim oLabel as object
dim newlabel as object

oSeq = oDataSequences(nseq)

     oValues = oSeq.Values
    newrepr = sValeurs
    newvalues = oDataProvider.createDataSequenceByRangeRepresentation(newrepr)
    newvalues.Role = oValues.Role
    newseqValues = CreateUnoService("com.sun.star.chart2.data.LabeledDataSequence")
    newseqValues.Values = newvalues

    oLabel = oSeq.Label
    newrepr = sLabel
    newLabel = oDataProvider.createDataSequenceByRangeRepresentation(newrepr)
    ' newLabel.Role = oLabel.Role --> pour Label, toujours = ""
   newseqLabel = CreateUnoService("com.sun.star.chart2.data.LabeledDataSequence")
   newseqLabel.Label = newLabel

   with oSeq
       .setLabel(newseqLabel.label)
      .setValues(newseqValues.values)
    end with

end Sub
and now … implemented your solution in my aplication … crashed L.O. !!!  … that’s the next challenge !


 … that’s the next challenge !