
Unless what you show in your sample is intended to be part of a larger text document, you’d be much better off composing everything in Calc. You’ll gain more power and versatility and perhaps won’t even need macros.
Hello !
Well … I know other ways to do something not far from what I want to do ! 
But … I’ld like to know if it is possible to, in some way, “redim” DataSequences array in diagram objet !
or directly and better something like "diag.setRange(“Table1.A1:D3;Table1.F1:F3”)
Thank your for your attention,
Philippe
I tried to made it simple and direct to the point …  … but I have some reasons to like to do it the way I describe it, which is mimetizing the user interface to configure the range used for the diagram.
Resuming: user can build document models and choose one of them to be used (copying data from spreadsheet). I do not know how, when programming, how model he designed. And l want to preserve everything the same (type,font, colours and so on) of the diagram in the copy of the model, to avoid repetitive work of configuration.
As you wrote :
that does not seem promising.
As I have been looking for a solution for a while I know it may be impossible. But I’ld like to be sure that it is really impossible. That there is no way, using some service for example.
And we can reach the point that it may be a good suggestion do have the option avalaible !
I don’t want volunteers wasting time with that if do not know the solution, as I already have some alternatives. But may be one has the solution already! Is here not the right place to ask ?
Thanks
IMHO, it is possible but you must not expect that anybody will do it for you since there is an easier way.
1 Like
I know that there a lot of easier way. The first on being to let the user to do everything manually ! But what will we learn this way! 
As I tried to explain. Till now all easier ways I found are not doing the same generally for 2 reasons:
1- graphic is not updated if user change a value in the table
2- user needs to configurate the diagram configuration everytime
I am so happy you could inform that it is possible ! … May be you could tell me the path I should start to follow ! I do not need anyone to do it for me … just helping with direction, may be links or name of wiki or so!
Thanks a lot
Philippe
Hi
For information: cross-posting with the French instance on which the OP has already had an answer with how to proceed to “reduce” the data range
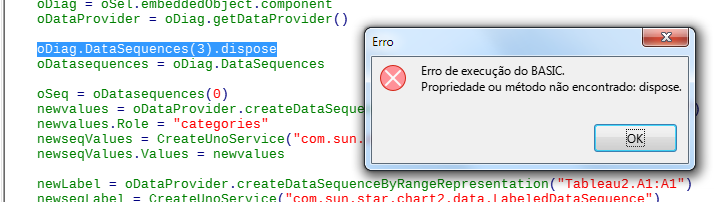
	oDiag = oSel.embeddedObject.component
	oDataProvider = oDiag.getDataProvider()

	oDiag.DataSequences(3).dispose
and how to modify the data sequence :
	oDatasequences = oDiag.DataSequences

	oSeq = oDatasequences(0)
	newvalues = oDataProvider.createDataSequenceByRangeRepresentation("Tableau2.A2:A3")
	newvalues.Role = "categories"
	newseqValues = CreateUnoService("com.sun.star.chart2.data.LabeledDataSequence")
	newseqValues.Values = newvalues

	newLabel = oDataProvider.createDataSequenceByRangeRepresentation("Tableau2.A1:A1")
	newseqLabel = CreateUnoService("com.sun.star.chart2.data.LabeledDataSequence")
	newseqLabel.Label = newLabel

	with oDiag.DataSequences(0)
		.setLabel(newseqLabel.label)
		.setValues(newseqValues.values)
	end with
AHAHAH …
PSY … you still did not tell me why only you have “dispose” for this attribute !
And I “explained” that this option may violate the diagram object integrity (which is probably the reason why DataSequences is readonly !)
bon week-end
Philippe
PS j’espère que je n’ai commis un péché mortel en tentant ma chance en anglais ! ça patinait du côté français … sinon, je m’en excuse !
I have not tested it for charts, but for a formula I need the below code to make changes visible.
dim XCOEO as variant
oXCOEO = oEmbeddedObject.ExtendedControlOverEmbeddedObject
oXCOEO.update()
Hello !
I guess that this way we are all wasting time. I tried to make simple and clear : just want to know if it is possible to change the range of data used by a diagram (mimetizing user interface).
I did not mention what my friend PYS (I thank so much for his help) wrote for 1 major reason + 2 regular reasons
0) 2 machine I tested does not have “dispose” method on datasequences array items !
- it does not make what I’ld like (modify range) … and there no symetric “insert” method
- I guess that using dispose of items of the array is not a safe way to do it (integrity of the diagram object)
Villeroy told us that it is possible (but after searching around a bunch I am less than hopfull!) … need to wait the idea he has. (API looks a bit weak and buggy! I search how to change column width of an array … not possible AFAIK!!)
Thank you all … just don’t waste your precious time to offer alternative solution !
Philippe
Formula ? in Writer table ? hum … are you really speaking about Writer tables ?
oEmbeddedObject.ExtendedControlOverEmbeddedObject
looks it does not exists in writer document …
Formula ? in Writer table ? hum … are you really speaking about Writer tables ?
No, I speak about a Math-Object. Math-Objects and Chart-Objects are managed the same way. They are located in the ‘Embedded Objects’ container of a text document. That is service ‘com.sun.star.text.TextEmeddedObjects’. The single element is SwXTextEmbeddedObject. And both Charts and Math-Objects have the same services, interfaces and methods. One of these methods is ‘getExtendedControlOverEmbeddedObject’, in Basic usable without ‘get’ by dot-access. That is in ‘com.sun.star.document.XEmbeddedObjectSupplier2’. LibreOffice: XEmbeddedObjectSupplier2 Interface Reference
The returned object is LibreOffice: XEmbeddedObject Interface Reference. That is the object in the state when you have selected it with a single click. And that has the method ‘update’ to update the representation of the object in the text document.
a community of people who share the same will to help others is a community of friends ! and you tried a lot ! thank you !
sorry, but as I wrote before : (property or method does not exist)
You might find ideas how to do the changes is the thread
https://forum.openoffice.org/en/forum/viewtopic.php?t=27290
and ideas, which objects are involved in the there linked method
http://hermione.s41.xrea.com/pukiwiki/index.php?OOoBasic%2FCalc%2Fchart2%2Fex3
A difference between Calc and Writer is the syntax of a cell range, so the part where the strings are manipulated needs to be adapted.
Hi Regina !
I gave a look at your suggestions. I’ll try to figure out if Hermione’s code can work for Writer, after adaptations ! (after first read, I recognized parts present in PSY code … but hum ! doubts! )
The link to oooForum does not work right now. I’ll try it tomorrow !
Thanks a lot for your attention.
Philippe
- Nobody seems to have experienced what i saw: The table - and consequently the chart - were rotten from the beginning. Only the integer numbers contained in the table were evaluated correctly because the
NumberFormatsettings were inconsistent: The language was (for me)Default (English), but the used decimal separator was mostly the comma, and only in one case the point. Only after the rectification the diagram showed something of meaning for the full range (A1:G5). - I have next to no experience with charts based on TextTable objects. The concepts of text tables are so inconsistent and error-prone that … (you’re right). Youi should not expect serious data presentation to work this way - and you should expect that charts with data from TT aren’t actually compatible with charts from spreadsheets. (Text tables even use a different column naming.) That’s all a mess, probably for “compatibility reasons”.
- If you finally want to move the chart creation to spreadsheets anyway, you should not expect that something having worked with a text table will also work in a spreadsheet.
- Develop with spreadsheets from the begiknning.
I attach what I got after making the NumberFormats of the table consistent.
plage1.odt (26.6 KB)
1 Like
Aha. Using the dispatcher to update the chart is a nice idea. I have tried method update() from EmbeddedObject. But in contrast to Math-objects it does not work for chart-objects.
Find attached an idea for Writer. Macro remove a series from chart.odt (20.3 KB)
In my test it did. See attached.
The code is raw, of course.
appendColumnsAsDataSeriesToChart_.ods (18.7 KB)
Test this, but add the colors to the aColors for more Columns.
diagram-ve-writeru-pokus1.odt (23.9 kB)
source: Apache OpenOffice Community Forum - Add multiple series in calc chart using macros - (View topic)