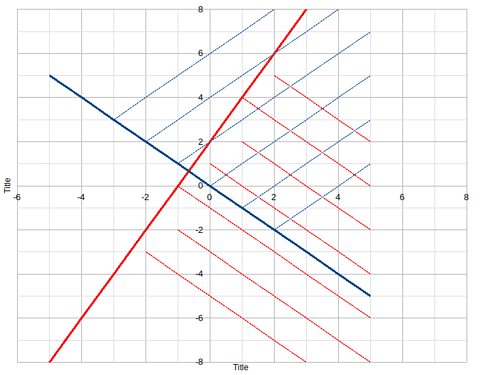
How to get hatching on an LO Calc diagram. See my try

Hello, thank you in advance for your time.

On a Calc diagram, with an affine curve (y = ax +b),
I would like to point out that a space above or below is not a solution.

Usually, this is done with hatching.

How to obtain hatching above or below a curve (in a very simple way :slight_smile:).

See my test (with two curves), which isn’t easy. I created a new line for each hatch, with a test to be above or below the curve,
LibreOffice Calc hatch diagram test 2023.ods (33.9 KB)

Thanks for all the advice :slight_smile:

Update. I need to mention that the area with hatching is in connexion with the curve :).
I am not looking for a background :slight_smile:

José from France.

hatch.ods (16.0 KB)

Have you tried to create a shape (with hatched area) in Draw and overlay it over you Calc chart?

@Villeroy
I believe that OP wants a hatch under some sub-area of the chart, not a global background.

Hello @Villeroy
I am not sure to have seen what you want to share with your file.

No curve, just a background?

@ajlittoz
I understand, but how to make this overlay in connection with the curve?

I am looking for a dynamic area. If I modify the curve, the hatching area has to change dynamically.
It is the case with my file :).

Imagine the case with a hyperbole and an affine :).

You can’t relate a Calc chart and a Draw shape because you can’t derive a Draw shape from some parametric model. This is the weak point of my suggestion: you must reproduce your curve “by hand” in Draw.

A silly idea (but why not ?): there is a parametric module in FreeCAD based on a integrated spreadsheet. Since FreeCAD shapes are controlled by parameters (which can be references to the local spreadsheet), this could be a lead. But the shapes there cannot be fully arbitrary math shapes. Polynomial and trigonometric curves should be accepted.

1 Like

Do you mean: let the red hatch lines be connected to the red curve?
For this task you need calculate and use some helper points (These are the intercept points of the hatch lines and the curve for the Scatter graph).

1 Like

Hello @Zizi64
Yes. Did you try with my file?

Here is my idea with x-Error bar and y-Error bar. I just use some large constant or some calculated error values for the curves. In this case I have used the positive x/y-error values only.
I know these lines are horizontal and vertical lines, but they are not slanted. But they can show the common area of the curves.

LibreOffice Calc hatch diagram test 2023_zizi64.ods (27.6 KB)

1 Like

Hello @ajlittoz.
It is not a draw. Hatching are curves too :).
They’re perpendicular because the “a” coefficient hatching multiply by the “a” coefficient of the main curve equal 1 :).
Did you see my file?

I will take a look about spreadsheet on FreeCAD. I have already used it and it is mainly to have a table of your parametric values.

Fantastic @Zizi64
You make it very simple!
Let me take a look at this.
But I think you propose an elegant solution :slight_smile:

just kidding

Depended on the type of the curves you need apply some tricks.
For example: for the y = x^2/2-5 equation and for “horizontal hatch below it” you must “divide” the curve in two parts:
Hatch_Tricks.ods (27.4 KB)

1 Like

Great @Zizi64
You have proposed the best solution :slight_smile:

Thank you, have a nice Sunday.
José, from France.

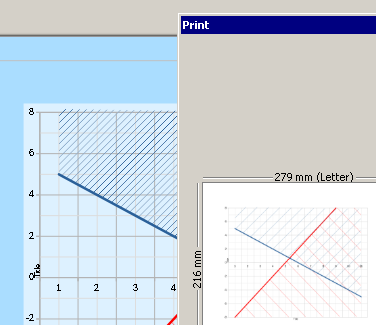
As a workaround, choose an Area chart, format lines and areas accordingly, copy and paste in Draw, and there delete some points and move others.
imagen
LibreOffice Calc hatch diagram test 2023 LeroyG.ods (26.5 KB)
LibreOffice Calc hatch diagram test 2023 LeroyG.odg (38.0 KB)

2 Likes

Hi @LeroyG, thank you for your time.
I am sure that is the answer.
If you have a new formula you need to replay with Draw.
See the answer from @Zizi64, it’s dynamics, you can modify your curve without playing with Draw.

Have a nice day, José