How to get the row numbers of duplicate values from a column

Short Version

I am trying to find the row value of a cell entry within a column that will have duplicate entries and need to know the row value so I can lookup other information on that row using VLOOKUP.

I have tried a mix of INDEX and MATCH but no joy so far.

In my example: I have a list of Fruits in Column A, like so:
Apple
Orange
Apple
Pear
Banana
Pear

I would need to be able to MATCH both the entries for Apple and return which row they are on.

Example.ods (14.4 KB)

Longer Version

The actual data I am working with is being imported and the amount of data will increase in time so have been actively avoiding solutions that might require another user to perform any form of manual adjustment or updating where possible.

Using Example4, I need to find the matching criteria from Column B and Column C, for example: Apple & Green and to then be able find the Quantity from column A, perhaps using something like HLOOKUP on the heading and then using the returned row value as the Array: Index for it.

I should also add that there are more variations than those shown in the Example4 spreadsheet as I have tried to keep things simple but it could contain be a mix of fruit, vegetables, flowers or whatever.

The current dataset I am working with comprises of almost 4,000 rows and is only going to increase.

Example4.ods (19.3 KB)

starting with Fruits … extending to Fruits and Colours … extending to Fruits, Colours, Quantity … and at least sophisticating the numeric Quantity to stupid Text like »seven« ?? Youre kidding us?
But the answer is again →→ use Pivottable
the stupid textual-numbers are replaced by real numbers with Number-Formatcode:
[NatNum12 title cardinal]0

Example4_pivot_with_kardinal_numbers.ods (23.6 KB)

Its a matter of 10 seconds to edit the source-range of Pivottables to any rowsize up to 16,000,000

disask98367FindMultipleMatches.ods (27.9 KB)

Thank you for the response, much appreciated.

I probably should have mentioned that I am using LO Calc version 7.5.7.1 and am looking for a more traditional formula approach as would like to avoid anything to do with Regex, Data Filters, Macros or the like as the spreadsheet could end up being used by others, so would rather avoid having to change any of the default settings.

Using the REGEX() function does not require changing any settings, only a LibreOffice version >= 6.2

You may need to abandon the project then. Solutions without REGEX() - and probably without TEXTJOIN() will be much more complex and need lots of helper columns and the like (imo). Yes. I designed such solutions for similar tasks long ago, and I can claim to know the complications.

User code might be a suggestion, but it is not involved in my posted example.

@erAck: A TEXTSPLIT() function as a well designed counterpart for TEXTJOIN() is missing for many years now.

Thank you for sharing your insights and for the clarification. Helper columns are fine as I can always hide those away later if needed.

Yes, that’s in the category of “spilling” functions which results may get spilled over several cells, which aren’t supported.

Yes.
But isn’t this the case with any formula needing to lock an output range if entered for array-evaluation?
I try to avoid such formulas due to the problems with scaling …

@Tad1:

Basically what you want to achieve is a variant of “filtering by formulas”. You may want to study this tutorial on the topic writtn by a very experienced user.

TEXTSPLIT is in the extension, even is not mention in the download page:
https://extensions.libreoffice.org/en/extensions/show/27434
It is possible to view the supported functions in:

The difference is that for spilling functions the matrix’ output cell range would be dynamic with arguments changing, normal array formulas occupy a fixed size cell range once entered.

The “non-dynamic” behaviour often is not actually appropriate. It also isn’t just shown by user formulas, but also by standard functions. Most relevant examples (imo):
FREQUENCY(), LINEST(), LOGEST().
I generally dislike locked ranges. This is also the reason for what I would not prefer the very clever solution suggested by @karolus in this thread over mine which avoids array evaluation -except inside TEXTJOIN()- and by that any locked range in specific. (A bit of handywork needed nevertheless when re-scaling.)

My solution uses TEXTJOIN() to avoid the spill-over-issue without fixing a maximum number of matches. The many needed internal collations may, however, reduce efficieny. (Supposedly by about the same factor as when using the other solution.)

My dream concerning array-evaluation: Where currently a locked output range is mandatory, there should be introduced an alternative creating a “in-cell-array”, a kind of table/2D-array similar to what’s created for charts not connected to sheets. That table should then be designated by a (optional?) property of the single cell containing the formula, but stored to a special container. A new indirecting function could then access any element of that table based on the designator created for the cell and returned by it using indices.
There might also be a way to connect/reconnect the table to a cell-range (like introduced for charts again).
Even an actual type for complex numbers avoiding the text-and-back-conversions might be implemented this way (or in a similar way).
MS Woul stand in awe.

Once more.
In my long comment I wrote about a “dream”. This wasn’t quite correct. I actually considered possible solutions for the “spilling issue” and created a proof of concept by user code included in a demonstrating spreadsheet nearly 7 years ago.
Just now I completed the old example with a few formulas in the sheet. No additional code.
If you (@erAck) can spare the time, I would be glad to get your comment on the attached demo.
KeepInMemory0.1.1.ods (40.7 KB)

No idea which usecase here? but anyway:

98367small_matches.ods (42.0 KB)

2 Likes

Thank you for sharing such a simple and elegant response. As you had asked about the use case, I have expanded upon my original example which I hope adds some more clarity.


The actual data I am working with is being imported and the amount of data will increase in time so have been actively avoiding solutions that might require another user to perform any form of manual adjustment or updating where possible.


Using Example3, I need to find the matching criteria from Column B and Column , for example: Apple & Green and to then be able find the Quantity from column A, perhaps using something like HLOOKUP on the heading and then using the returned row value as the Array: Index for it.

Example3.ods (15.9 KB)

So … your needs are in the End:
aggregating the QUANTITY by criteria FRUITS, and COLOUR
the most simple way to do this is →Data→Pivottable:
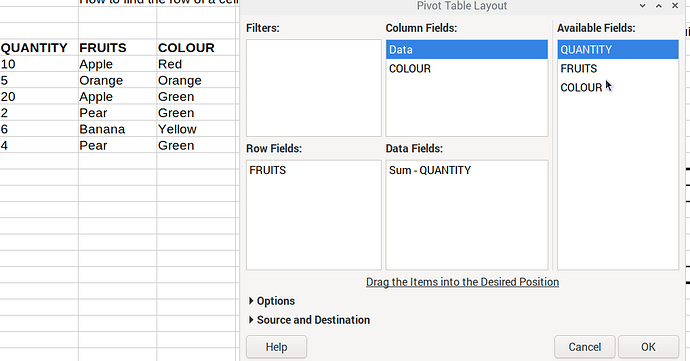
drag&drop FRUITS , COLOUR and QUANTITY into the respective Fields like in the screenshot:

98367_with_pivottable.ods (19.2 KB)

Thank you for your suggestion and if I was working with a fixed dataset that would indeed have been an elegant solution and have edited my original question and will upload a better example to help demonstrate this.

Example4_1.ods (19,7 KB)

1 Like

Thank you very much PKG, that is the kind of solution I was looking for.

Also, thank you for making me aware of the AGGREGATE function which I was easily able to use and also able to easily add an additional column mix like so:

=IFERROR(INDEX(ROW($A$1:$A$22),AGGREGATE(15,6,ROW($B$1:$B$22)/($B$1:$B$22=E$4)/($C$1:$C$22=“Green”),ROW(A1))),"")

This will really simplify things going forward, so thanks again!