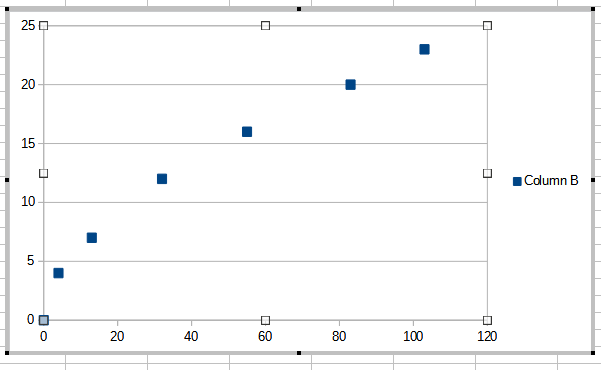
How do I know what value y is when x is 76? Is there a way to do this?

Mathematical calculations from images/screenshots are hard to perform.
I added the .ods file, could you help me?
If these points are discrete data (and they are not some displayed result of an existing and known continuous function), then
Please upload you real, .ods type sample file here.
I added the .ods file. So how can i do it?
It looks like as an y=ax^(1)+bx^(0.5)+cx^(0) function, where c = 0.
See the regression function and the estimated value for x= 76 based on the regression line (based on the regression equation). See the attached file in my answer above.
Hello,
may be the following sheet gives you an understanding of how to do such stuff. Generally speaking: Regression analysis doesn’t make much sense if there is no (functional, mathematical) model at all about the functional relation of (in your case) X and Y data (and you did not provide any such “assumption” about the dependency). Therefore the file shows the values derived from various assumptions about the functional dependency (polynomial up to 4th degree, and a power functional dependency according to f(x) = a xb).
RegressionAnalysis-Q288822.ods
You may want to read the following help subject:
Hope that helps.