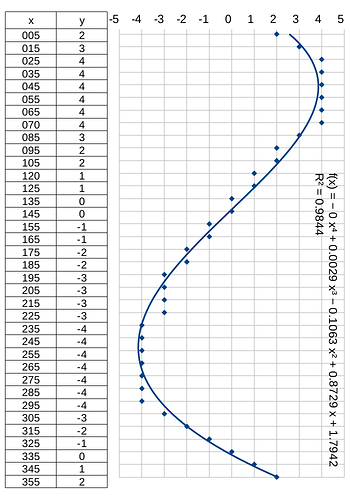
I have used Calc to perform a polynomial regression on a two-dimensional dataset (x,y) by
- charting the two-dimensional dataset as a scatterplot (Chart Type: Line, Points Only),
- fitting a polynomial curve with 4 degrees (Insert Trend Line), and
- displaying the coefficient of determination of a linear regression and the equation of the polynomial curve (Insert R² and and Trend Line Equation).
The coefficient of determination is very good (0.984) and the trend line fits the data.
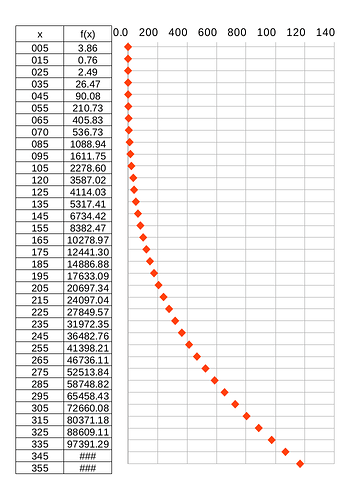
I have then applied the equation of the polynomial curve to calculate values of y given x, but the results do not fit the data, the error/divergency increases with x.
The “Trend Line Equation” is:
f(x) = - 0 x^4 + 0.0029 x^3 - 0.1063 x^2 + 0.8729 x + 1.7942
I have applied the following function:
=-(0A2^4)+(0.0029A2^3)-(0.1063A2^2)+(0.8729A2)+1.7942
My questions are
- Can the coefficient of determination of a linear regression (R²) provide valid information about the fit of a polynomial curve?
- What is/are the alternative/s?
- How do I calculate y given x using the “Trend Line Equation”?
EDIT


