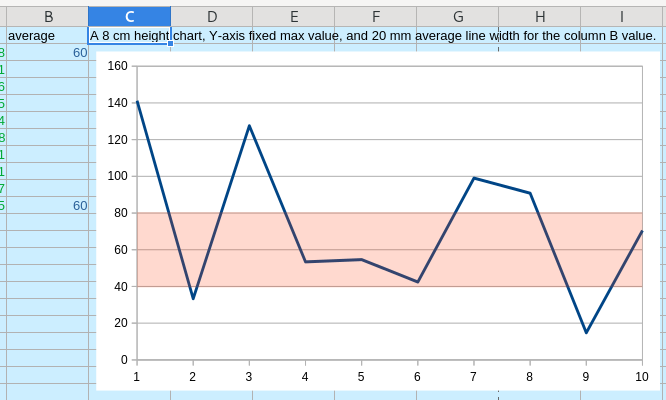
Is it possible to create a horizontal band (not the entire wall) of color on a line chart? If so, how. Thanks.
Please demonstrate (somehow, for example by an image) what you want to achieve really.
Just a tip: an added Graph of constant values and with thick color line?
Insert an Image as a background. See attachments.
.
YellowBanner.odg (11.2 KB)
HorzontalBandInLineDiagram.ods (27.1 KB)
.
Related question/answers:
How do I change part of the background on a (blood sugar level) line chart
Edit: 2025-05-22:
band_LeroyG.ods (26.1 KB)

I took the end of the yarn that @cwolan left, and I found the ball.
Thanks fo Zizi64 and Grantler for your helpful responses. I knew there are smarter people than me out there. 

