LO 6.0.4.2 on Ubuntu 16.04 LTS.
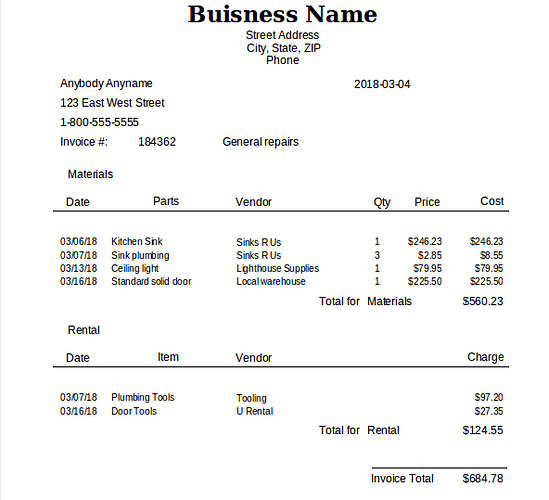
Just started working with LO Data. Was able to quickly put together 3 tables and a form with 2 subforms to track time and materials costs of art projects. (I’m an Oracle DBA, my wife is the artist). Main table for projects, two child tables, project_time and project_materials. Form has a grid subform for time and another grid subform for materials. At this point, form is a bit crude but functional. Now I need a report. I envision a report with a group header showing data from the PROJECTS table, a sub-group showing detail and summary of time, and a second sub group showing detail and summary of materials. Something like:
Project Name:  xxxxxxx
  Time:
      Date         Time (hrs)
      6/1/18      3.5
      6/2/18      2.0
      6/3/18      0.5
                       total time         11.0 hrs
  Materials:
     Item                     UOM             Unit Cost    Qty Used     Item Cost
     paint, oil, red         tube, 2oz     2 .35            1               2.35
     paint, oil, blue       tube, 2 oz    2.35              2              4.70
                                                              total materials     7.05
On the detail lines, all columns are from the respecitve table, except “Item Cost”, which is calculated at run-time (unit cost * qty used.)
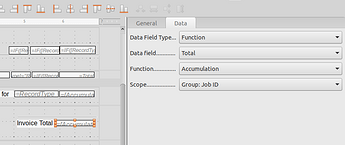
I’ve played around a bit with both the report wizard and manual design, but have not figured out how to do this. I don’t think I need a detailed tutorial (though if there is already one available that addresses this kind of report, I’d be happy to look at it) but just some pointers on how to approach it.
Paint, red, oil


 (upper left area of answer). It helps others to know there was an accepted answer.
