I have a table of data like this
0	-105.0
10	-114.3
20	-121.8
30	-127.0
40	-129.6
50	-130.8
60	-131.2
I’ve discovered the LOOKUP() function, which lets me input a value from the first column and returns a value from the second column. (=LOOKUP(20, A1:A7, B1:B7) returns -121.8, for instance.)
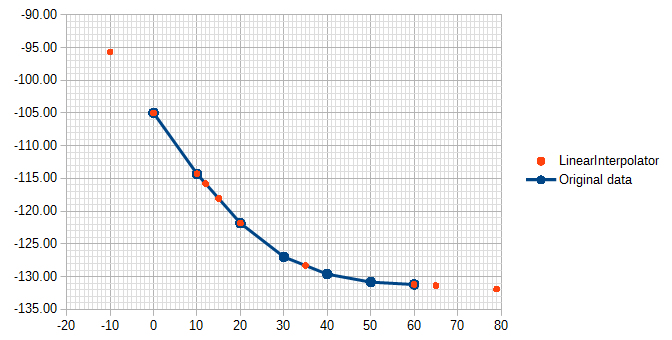
But is there a way to use linear interpolation to fill in the gaps between the samples? For example, a hypothetical =LERPLOOKUP(15, A1:A7, B1:B7) would return -118.07, the midpoint between the 10 and 20 values.
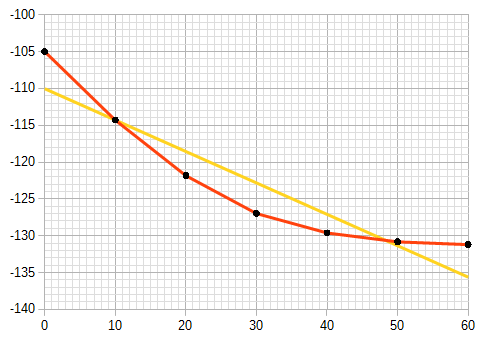
In other words, if the data is the black dots, it should find points along the red lines (linear interpolation), not along the yellow line (linear regression):

(and maybe linearly extrapolate outside the data, though that will be totally wrong for some data, and become increasingly wrong the further out you go.)

