Names on X axis of XY or bubble chart

I have an XY chart that shows some values associated with some names. I don’t have enough points to upload it here, so you can get it from this location instead.

The X axis shows the numbers from the “No” column (A), but I would like to show the names from the “Name” column (B) instead. Is it possible to do that? If I simply try to change it to use column B, it uses row-based numbers instead.
Same question for a bubble chart.

I also found a similar question which was WRONGLY closed without any answer that addresses it.

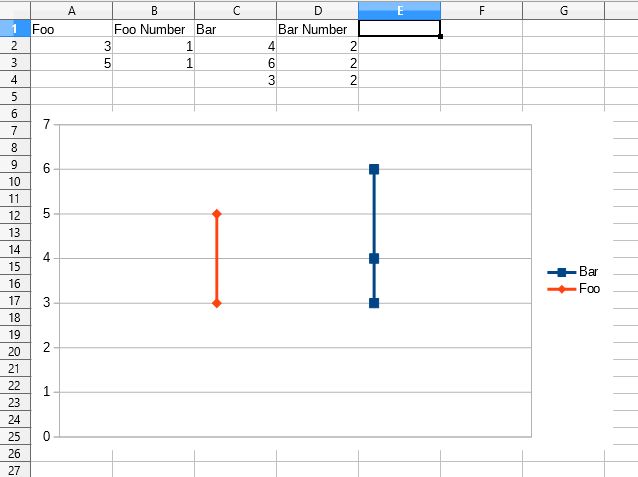
One possibility is to use a separate data series for each name. chart4.ods

foo and bar in separate series

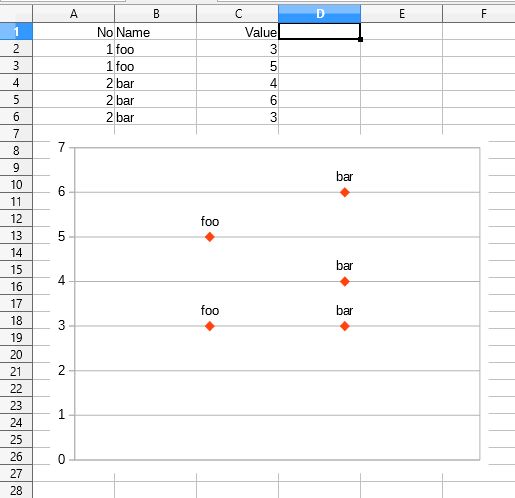
Another possibility is to use data labels on each point. chart5.ods

data labels

Unlike XY charts, Bar charts can use categories for the “Name” column. However, I did not see a way to plot multiple points in a line with that approach. So it looks like the best way is to chart the data based on numeric values for foo and bar, as in your example.

These are interesting alternatives, but not exactly what I wanted to do. So I guess it’s just not possible currently.