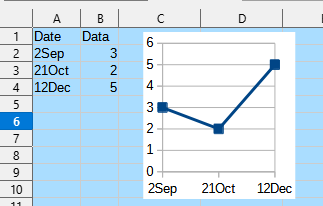
My date column entries are typically 2Sep or 21Oct. Is there any way I can use these as X axis data? Or is there a way to convert these to days through the year so I can use that day number?
thanks
Do you mean you need a chart showing those two autumn days over several years?
No. I want to plot a column of data over a year using the dates I have, there are only a few per month. Dates on X axis, data on Y axis.
Precondition is that your dates are formatted numbers. It won’t work with text values like “1/2/2024”.
ask112881.ods (39.3 KB)
Do you need an XY (Scatter) chart, or just a Line chart being the space between values without relevance?

Your 3 point graph is just what I want except I want the gap between dates to be reflected into the data position on the x-axis. What do you get if you change 2Sep to 2Jan? Same plot I suspect.
Most likely your dates are stored in each cell as text, because they do not conform to any “date acceptance pattern” (at least not in the few languages I checked). This means that you need to convert to proper date value.
- Typically, you’d use the
DATEVALUE()function to extract a “proper” date value from a text. - To make
DATEVALUE()work, you need to reshape the date string so it matches a date acceptance pattern. This can be done with theREGEX()function.
Assuming that you have 1 or two digits for day number and 3 letters for the month. To be recognisable as a date you need to add a space between day and month, and a period after the month abbreviation. A “defunct” date entry in A1 is handled by this formula:
=DATEVALUE(REGEX(A1;"([:digit:]{1,2})([:alpha:]{3})";"$1 $2."))
This will return a number, the “count of days from epoch” (“epoch” in this context is the day chosen as reference point ; for Calc: end of 1899, roughly). This day count can be formatted to a date value again if you like. Youi will be using this for the X axis value, so reformatting to date display makes your chart look more sensible. (You can also format the chart axis labels explicitly, if you prefer).
See mockup:
DateExtractionMockup.ods (18.1 KB)
Note that date applications are more reliably managed when you use the ISO date format, as per @Villeroy’s more elaborate example.
Also, if you are using this over time and it needs to be historically accurate, you may want to add year to your dates. When year is not given, the DATEVALUE() function will assume current year, which of course changes over time. If all entries in a file are same year, the year can simply be entered in a single cell and added by formula to the string output by regex. No need to manually edit each entry.
How do these text values get into the cells? Manually? Copy/Paste? Imported from text files?
What is the locale setting under Tools>Options>Language Settings>General?
Brilliant keme1 - just what I need!
If I subtract 45292 I get the days into the current year so I can now do a plot of the years data.
Thanks again. I’d never have worked this out on my own.
Thanks for getting back Villeroy, but I’m sorted now thanks to a DATAVALUE formula from keme1
cheers
Geo
Yes, and no.
No, because if you subtract 45292, your count of days will use the year 1900, which was not a leap year. This year is 2024 - a leap year. Depending on your perspective, either the two first or the ten last months will be one day off. There will never be a 29Feb.
Yes, because it is not likely that this creates any significant visual deviation in a chart.
When you create a chart, it will usually shift the axes to accomodate a sensible graphical display of your data. Thus, you can safely keep the numbers as entered for the chart creation. If you specifically need the count of days for some purpose, your subtraction makes sense of course.
Something to be aware of for sure but one day out isn’t going to matter for this particular graph.
thanks!
