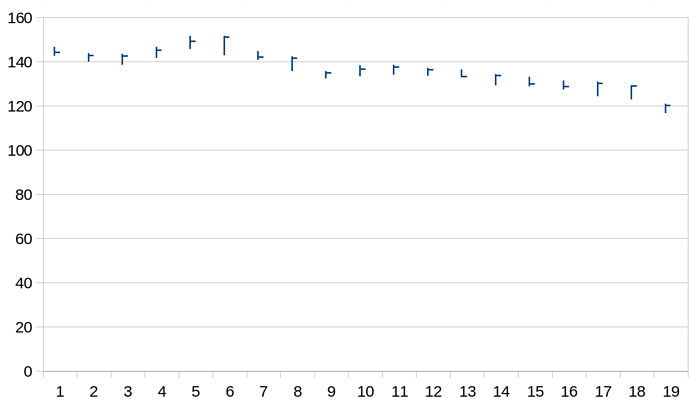
If I create a chart for a stock price, using “auto” mode doesn’t create appropriate scaling values, which wastes partly more than 50% of the diagram height. This issue doesn’t depend on scale-type linear or logarithmic. When trying different diagram types I realized, that auto scaling doesn’t work at all - great.
As far as I remember this function has never been functional as long as I use LibreOffice… Does anyone have an idea, why it has never been listed as a bug?
It hardly can be meant serious, that a diagram height is only used by 50 % (or even less)… can someone give me information, please?
This occurs in 7.4.2.3 and several older versions (at least 7.x.x.x as far as I know). Currently I can’t access my Windows machine, but using Linux (no matter whether Debian or Ubuntu, no matter if flatpak - which I have deleted meanwhile, as it only stole my time…), natively installed (by Debian package, or even as AppImage - it’s always the same.
What if you attach a sample file, so someone can take a look at it?
Just guessing: If the Stock Chart 1 type is choosen, the values of the fourth column are not shown, notwithstanding they are taken to set the Y-axis scale.
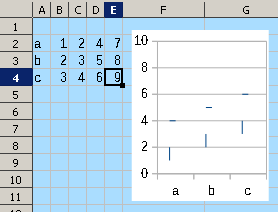
StockChart1.ods (12.3 KB)
LibreOffice 7.2.7.2 on Windows 6.3.
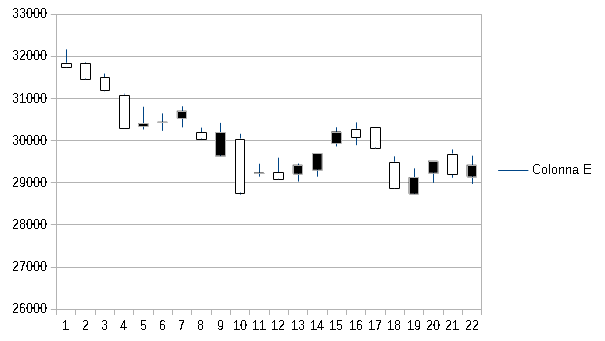
This is how a chart of 1024 ticks (or days) look like with completely automatic scaling. Scale mode is logarithmic. By hand the minimum and maximum at the y-axis is 2.00 and 2.55, the uploaded image, as one can see if zoomed, shows a scaling fom 0 to 3… that is simply crap, sorry.
And that is everything but new.
The bar chart obviously is broken as well, because - as visible - it “eats” the opening prices (which - in the data for this diagram type - is given and demanded, but not displayed).
To say it clearly: It seems, that there are only very few users who work with LibreOffice in an at least halfway professional manner. And the almost only data they process with it is obviously text.
Thank you all for your effort, but it sadly seems as if I will have to move to a professional office solution, because working with an application and working “around” it (in the sense of permanently looking for work-arounds - or less politely: fumbling around with it) doesn’t fit together and is not practicable at all. There are several other errors and flaws I know of… and all of them are quite ancient and obviously nobody cares about them, what let me assume: LibreOffice is a tool for a very limited type of data (which may work reliable, perhaps…), but… for any type of professional work it is simply a waste of effort and resources.
See the picture
Villeroy, your diagram also only uses 50% of the available height - simply way too little. And as soon as you use a logarithmic scale things getting worse (try it).
This is because auto scaling works. Enter value 110 or 90 and the scaling adusts accordingly. If the automatism does the wrong thing, you are the one to turn it off and define your own scaling.
Dear Villeroy, this is the sense of auto scaling. Every day the diagram gets new data and in an up- or downtrend this forces me to update every document after only few days, which is unusable. Without working auto scale it’s a tedious fumbling (apart from other, similarly time consuming flaws, which (like the here discussed) are “alive” since more than at least one year (!!!)).
Villeroy, auto scaling is needed in my case for a hand full of diagramms in at least 20 documents (a hand ful in each of these at least 20). Adjust by hand is a job for itself and… additionally LO crashes while working after … 3-5 documents (as mentioned: There are more severe flaws).
Thank you for the effort, but… from LO there’s simply too much effort/work in partly strange directions (there’s so much work to make LO MS-compatible, instead of fixing serious bugs, like the one which makes it crash or makes each scrolling and zooming a nightmare). As mentioned: Way too much work for too stupid and everything but comprehensible targets.
Having a stable app should be by far more important as making it 99.9% instead of 99.5% compatible to MS Office (which is the current way of the so-called “development”, amongst other - from my perspective - unlogical and not comprehensive development targets).
In my eyes it is simply a mess, that even some weaknesses of MS Office were “cloned” (according to users who used MS Office before) instead of at least keeping first and foremost LO stable and free of flaws. They don’t want it to be compatible, but obviously a twin.
Have you ever tried scenarios with charts? The idea is that you create one chart and make the underlying data sets exchangable.
https://ask.libreoffice.org/uploads/short-url/gJR9ckCZ106LVDN6ENPlXVg4Tz6.ods (ignore any macro warning. There is no macro in that document)
My concept consist of one tab which holds raw data together with a little pre-processing, one tab holds some constants needed for the indicators, 4 tabs contain calculations, another one collects the numbers for the diagramms - to make this easier comprehensible - and then there’s the tab with diagrams.
Surely it would be enough to make the scaling by a script, … but how does that interfere with the latent instability of LO? As stated I have to restart it during an average day (and that’s not even “hard work”) usually at least 10 times (!).
If I had the time I would program it completely, but… I need time to earn my money while programming… that’s my real dilemma
Update:
After deciding to migrate my projects to a “downgraded” LO (7.3.6.2) I opened one of the documents, that 7.4.2.3 had such enormous problems with… and got a very strange, but somehow logical sounding error message:
Office 7.3.6.2 claimed, that the number of coulumns exceeds the maximum allowed number - what is impossible, because the maximum amount of columns in (only!) one sheet (of 9) is 88 columns. Interestingly although I ignored this message I opened the documents … and there was no error (!) and nothing was missing (nothing truncated)… So I guess, it is an error somewhere in 7.4.2.3, which is said to be able to handle a higher number of culumns…
This would explain the massive problems with even acceptable table documents, because … perhaps it handled it as with a massively higher number of cells… Nonetheless strange.
7.3.6.2 BTW works very without any problem… and fast as if there has never been any problem… well, this doesn’t help much with the scaling, but… if LO is no longer crashing and running like a snake in holidays…
A sceen shot does not demonstrate anything at all, except display issues.
Villeroy, sorry to say this, but your reply sounds like an excuse! Even my reply to LeroyG (see above) shows the defect auto scaling very clearly .
The screenshot of the diagram I have posted is a small piece of price data from the real chart document of the Adidas stock price (XETRA, Frankfurt/Main) drawn with an - obviously also defect/buggy/erroneous bar chart using a linear scale type in auto scaling mode.
Such a diagram draw engine simply is a time eater (especially because the scaling is not the only issue)!
Don’t forget: We’re talking about an office suite, which has to be used in an office environment, where its functions have to be used daily without “manual” fumbling (because in an office nobody has the time for such “playing around” - if you don’t understand it: Work in an office and you will understand very soon!).
May be such software issues are acceptable for some pupil, who wants to make occasionally a document with a few diagrams… but as soon as one needs to earn money with it sucks really!
Again:
I currently make use of something like 40 chart documents. Each one contains of price and indicator chart diagrams. As of now I will have to replace - manually - the scaling of currently 6 charts In each document (of a two-digit number of documents in my still growing collection of documents). If most prices are in a strong trend and most of these stocks follow the trend, I have to update at least 50% of them, means 20 * 6 axis minima and maxima at least once in a week - additional to the anyway necessary updating and analysis. And I need to increase my database by the factor of at least 2-3, which increases this problem as well by the factor 2-3!
Mentioning of display issues therefore is no help at all, when there are charts visible yet, which display the program flaw very clearly!
So if you simply have no idea, why don’t you simply tell this instead of posting such useless “information”?
Your statement, “auto scaling” works when inserting scale values manually (s.a.) also is simply wrong, because the word “automatic” mentions, that such has to work w i t h o u t manual action at all!
What is complicating in finding the lowest and highest value out of a set of data? And… if the scale is set using these found minimum and maximum in conjunction with a “coverage factor” (which tells how much of the available space in y-direction is taken by the diagram), it is always scaled perfect without any need to re-adjust. For the sub-dividing there would also be a much more logical option helpful: Choose the first x digits of the shown values as main scale division (main grid size) and as sub division there would be imaginable either a fixed subset of these values (like “sub-divide in x pieces”) or offer to define the second digits of the sub-division (like “use ciphers 1, 2, 5” in logarithmic scaling or “use 2,4,5,6,8” in linear mode). This could be refined, but surely would already result in much more useful scaled diagrams.
But: Such details need a support of users with a good knowledge of these things (like diagrams in this case) in a good and steady contact with the developers - and that obviously doesn’t exist for LibreOffice at all!
People are having to guess and try to recreate the problem they think you are facing. If you were to create a small anonymised sample spreadsheet with the issues you see it would take very little time and would make it clear to all
Calc 7.4 has more columns, 16384 , see LibreOffice 7.4 Community: Release Notes - The Document Foundation Wiki . Earlier versions will complain only if there is data in the columns beyond their capacity to open. Maybe there are calculations involving as far as the last column (array function?) or just some inadvertently placed data
If you have to restart LibreOffice 10 times a day then there is an issue somewhere. Have a look at First steps to take before submitting a bug - The Document Foundation Wiki .
Contrary to a screenshot, my document demonstrates that the scaling does adjust automatically to the entered cell values.
Nobody can reproduce your problem staring at screenshots. Screenshots are completely useless.
Ok, here is your document, together with 2 diagrams - each created with completely automatic scaling.
It is completely unnecessary to insert a big diagram, because small ones are not better.
Furthermore: None of you here have shown at least basic practice with diagram creation and evaluation, sorry. That does not help, because you obviously don’t even understand the sense of my “complaints”.
If you’re working with Base or Writer mostly and … only occasionally use Calc (and even then you only make sparely use a few diagrams…), then you will never understand the reasons for my statements.
That’s why I stated, that LO obviously isn’t used by many users. The few of them, who indeed use Calc, mostly have stopped using diagrams at all. That’s the only reasonable explanation, why even “broken” charts are still amongst LO’s “available functions” and I’m pretty sure, that the above mentioned bar chart was working in a far past (or even in OpenOffice)… although I don’t know it for sure.
But… simply the fact, that there are broken functions included since several years (!!!) that not one single user even is aware of shows the real situation of LibreOffice. And after having a deeper look into all the open tickets of LO this imagination became a deep convince.
BTW: My statements are in fact replies several times to Villeroy, but…
obviously there is nobody around who knows at least what I’m talking about (or also possible: Who knows not only good, but way too good, that such issues are the comparably tiniest problems of LO).
I’m sure, LO’s userbase is by far more limited in number and versatility as stated.
And for now I have to work and will come back later - thanks to those, who take the trouble to at least reply.
Scaling-Issue.ods (45.3 KB)
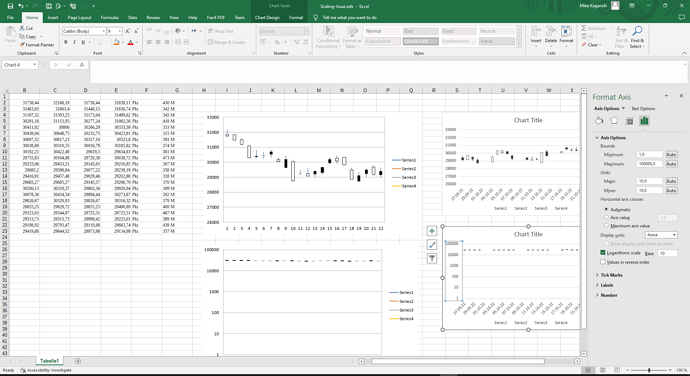
- I tried to use your data in MS Excel 2016, to create stock diagrams from scratch there. Curiously, they used
26000…33000range for linear scale Y axis, and1…100000range for logarithmic one (in auto mode, indeed). I suggest we do the same, and dump our stupid “try to find a better range, and only have two main ticks around” code, making our logarithmic range1000…100000. (Not mentioning to someone who does understand the sense of their “complaints”, that logarithmic scale has a specific purpose, and using it when your data doesn’t span at least an order of magnitude values is useless, not the intended use of the feature.)
- Then I tried with Google Sheets, and guess what, they didn’t have any automatic scale feature at all… (not to mention that they couldn’t create such a chart, unless you make the first of mandatory 5 columns textual.)
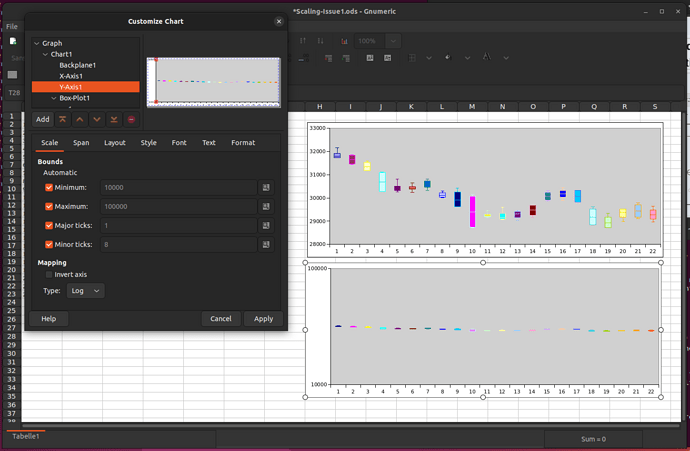
- Then I tried Gnumeric. And yes, it used somewhat smaller vertical automatic linear range:
28000…33000, but the same logarithmic as LibreOffice:1000…100000.
So the overall conclusion is that we perform at the very high level compared to industry standard, and even if improvements are indeed possible, it’s unfair to claim all you claim.
- Your lengthy complaints are targeted at what? What specifically you expect to achieve when writing all that on a user-to-user site?
I give up.
Thank you all for your replies, but this topic is something nobody realizes (by will or not is not relevant). This thing exceeds my time and… as long as everyone obviously is willing to work with hand-made crutches full of fumbling… (and in case of something like MS Office even is willing to pay money for such garbage!) good luck.
As already mentioned: Thank you all for your patience, but for now I have to work.
And as soon as I find the time I will realize a solution for myself. If this is what most people are looking for - why not?
Have a successful day to all!
Yes, there are a few empty lines below; but this don’t bother me.
But it would be good that non-automatic minimum and maximum for the scale could be set in a cell, next to the chart values (or whatever). Worth of an enhancement request.
This would be something I thought as well… if scale end values could be inserted by a reference (cell values) everyone could easily choose somerging individual… and - even more - very flexible.


